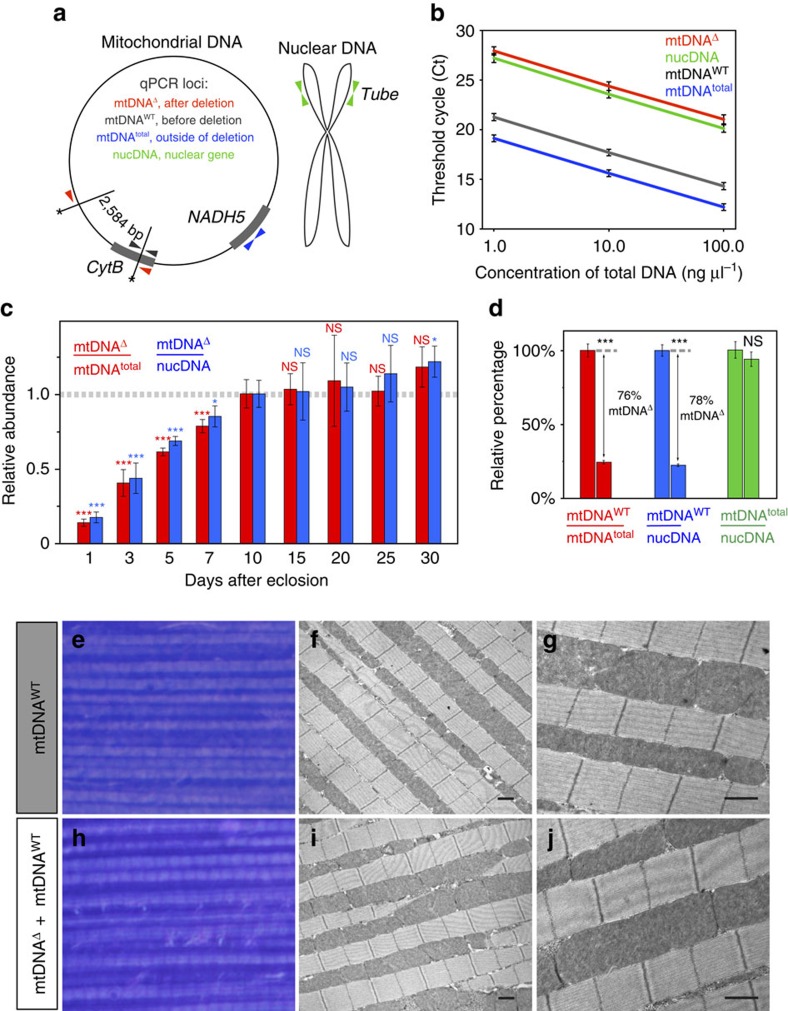
Figure 2. qPCR quantification of mtDNA species and effects of heteroplasmy on muscle structure.
(a) Positions and orientations of qPCR primers are indicated by arrows. (b) Four standard curves connecting three average Ct values (±1 s.d.) for each primer set. (c) The amount of mtDNAΔ in the IFMs of mitoAflIII flies increases through the first 10 days after eclosion and stabilizes afterwards. Relative amounts of mtDNAΔ were estimated using qPCR normalized to the levels observed in 10-day-old flies, which were assigned the value of 1. Minimum four biological replicates were quantified for each time point. Statistical significance is calculated relative to the values in 10-day-old flies. (d) Quantification of mtDNA forms in flight muscle from 10-day-old P{pIFM-Gal4}attP1 (wild type, left bar of each pair) and mtDNAΔ -bearing P{pIFM-mitoAflIII, pIFM-mitoT4lig, pIFM-Gal4}attP1 (mitoAflIII, right bar of each pair) flies. mtDNAWT depletion among all mtDNA molecules (mtDNAtotal) corresponds to emergence of mtDNAΔ molecules: that is, mtDNAtotal−mtDNAWT=mtDNAΔ. Bars depict mean±1 s.d. (e,h) Toluidine blue staining, and (f,g,i,j) transmission electron micrographs of indirect flight muscles of 10-day-old flies. Wild-type (e–g) and mitoAflIII (h–j) flies have similar muscular ultrastructure. Scale bars, 1.0 μm. Statistical significance was calculated using Student's t-test with unequal variance. NSP>0.05, *P<0.05 and ***P<0.001. NS, not significant.

