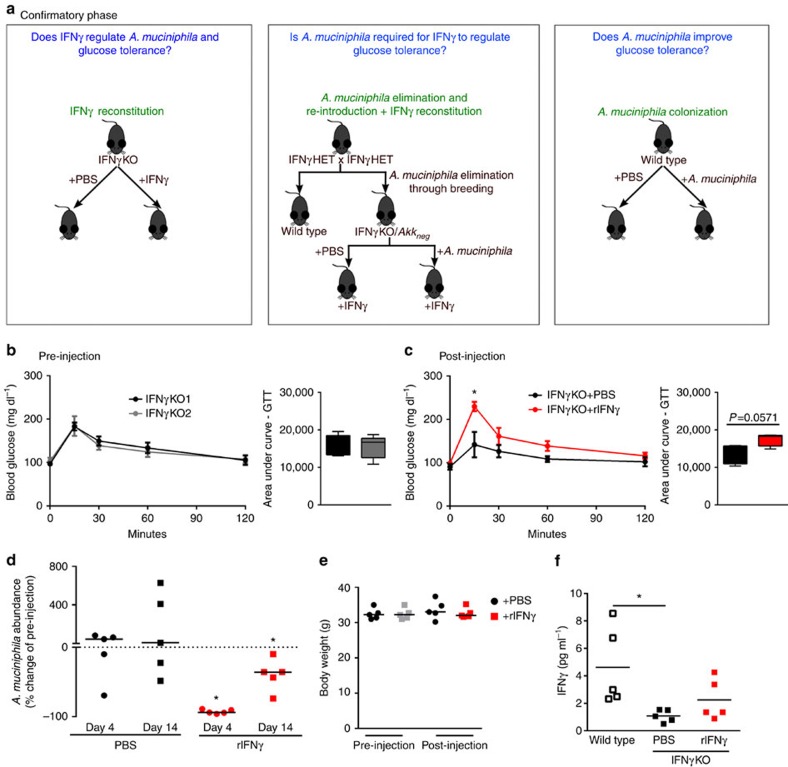
Figure 2. IFNγ reconstitution validates IFNγ as a regulator of A. muciniphila and glucose tolerance.
(a) Experimental outline describing the confirmatory phase where the identified candidate from Fig. 1b exploratory phase, A. muciniphila, is directly tested by three independent approaches. Readouts of all experiments are quantification of A. muciniphila abundance and assessment of glucose tolerance. (b,c) IP-GTT and area under the curve of IFNγKO mice before (b) and following 2 weeks of rIFNγ or PBS administration (c). (d) A. muciniphila was quantified by qPCR. Shown is percent change of A. muciniphila abundance in stool from initial pre-injection levels after the 2-week injection period. (e) Body weight of all groups of mice pre- and post-injection. (f) Serum IFNγ levels at the post-injection time point. Glucose tolerance curves shown as mean±s.e.m., box plots represent median with 25th and 75th percentile borders and error bars represent min–max. Median line is displayed on dot plots. For all glucose tolerance tests and qPCR results shown, n=5 per group. *P<0.05 by one-tailed Mann–Whitney test.

