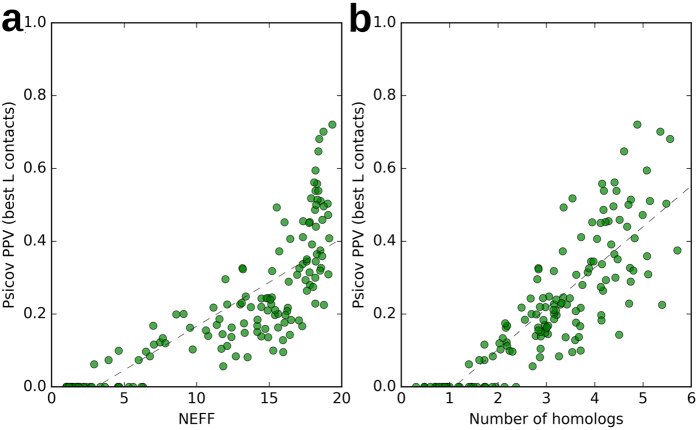
Figure 3.
(a) Shows the correlation between the NEFF and the PSICOV performances on 150 proteins sampled from the STRUCT dataset (Pearson’s correlation coefficient is 0.83). (b) Shows the correlation between the number of homologs (expressed in thousands of homologs) and PSICOV performances on the same proteins (Pearson’s correlation coefficient is 0.70).

