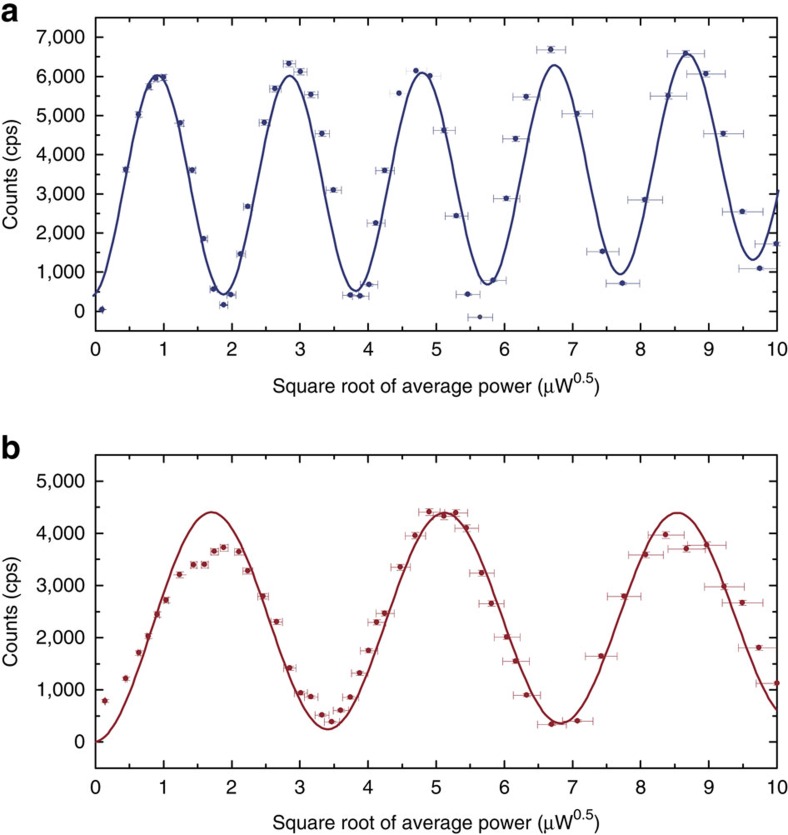
Figure 2. Optical one-photon Rabi oscillations.
Measured photon counts as a function of average laser power (after subtraction of background fluorescence mainly caused by milling of solid immersion lenses) for the picosecond laser pulses resonant with (a) transition C and (b) transition B. In both cases pulses with 12 ps length (Δν=20 GHz) and a double-sided exponential temporal shape (due to filtering with a Fabry–Perot etalon) have been applied (x-errors (s.d.): measured relative laser power stability, y-errors (s.d.): Poisson-distributed count rate errors  ). The data in both graphs is modelled by a four-level density matrix model (solid lines) including spontaneous decays between the excited and ground states as well as the phonon-induced decay and thermalization processes within the ground and excited state manifolds. All rates have been measured experimentally and no additional free parameters have been employed to model the Rabi oscillations (Supplementary Figs 1–3, Supplementary Note 1).

