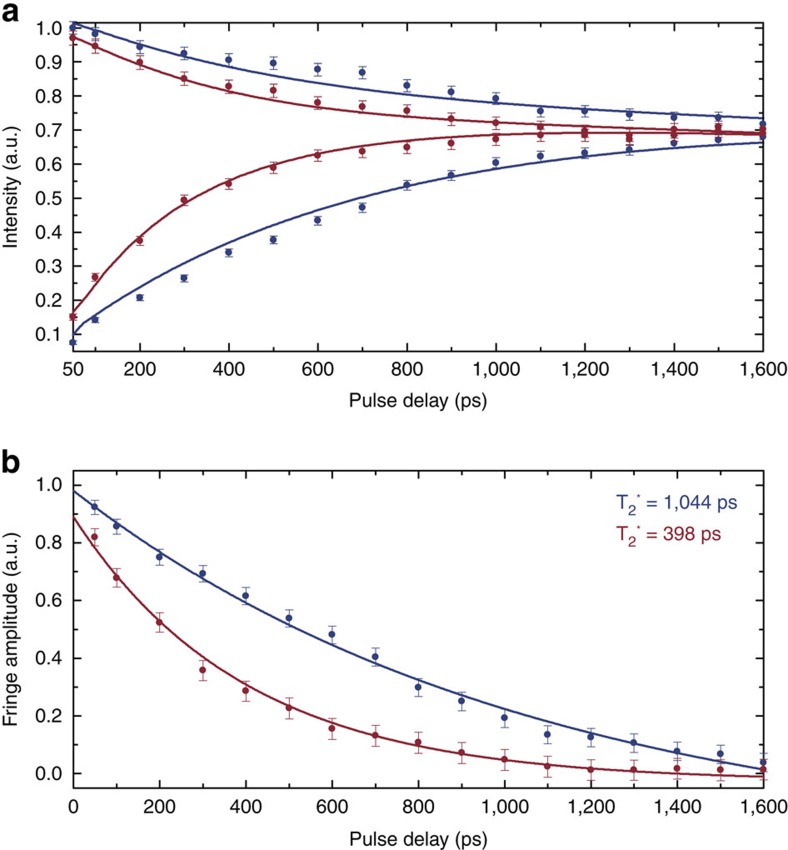
Figure 3. Optical one-photon Ramsey interference.
Interference fringes can be observed by applying a sequence of two picosecond  -pulses with variable delay, a so-called Ramsey-sequence. (a) Upper and lower envelopes of the observed interference pattern for transition C (blue) and transition B (red). Individual fringes are not resolved due to their short oscillation period at optical frequencies. (b) The excited state coherence times can be extracted from the decay of the interference fringe amplitude. From the amplitude decay on transition C (blue) a coherence time of
  =1,044 ps for the lower excited state can be extracted by simulating the decay using the four-level density matrix model (solid lines). Analogously on transition B (red), a coherence time of
  =398 ps is measured for the upper excited state (y-errors (s.d.): Poisson-distributed count rate errors
  ).
).

