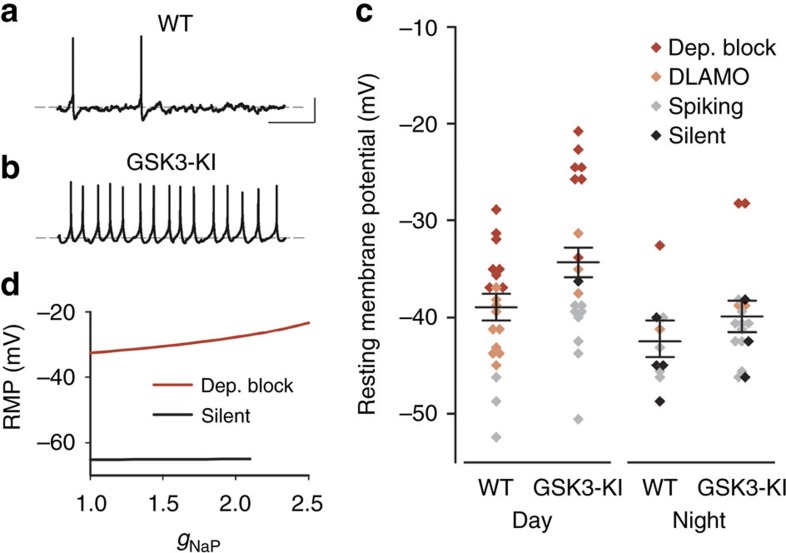
Figure 7. GSK3 activity promotes nighttime excitability without affecting RMP.
(a,b) Representative whole-cell current clamp recordings (5 s) from WT (a) and GSK3-KI (b) SCN neurons in early-night. Scale bar, 20 mV, 1 s. Dashed grey line indicates −40 mV. (c) Dot plot of RMP for individual WT or GSK3-KI SCN neurons recorded from during the day or early-night. Lines indicate mean±s.e.m. for each group. Cells were significantly more depolarized during the day and in GSK3-KI slices. Two-way ANOVA; main effect of time, F(1,64)=7.474, P=0.008; main effect of genotype, F(1,64)=6.099, P=0.016. From left-to-right, n=21 cells, four animals; 19 cells, three animals; 11 cells, three animals; 17 cells and three animals. The effect of genotype on RMP was driven by groups of cells in depolarized block (non-significant main effect of genotype when depolarized block cells were excluded from analysis; F(1,54)=0.623, P=0.433). Symbol colour indicates subgroup phenotype as indicated in the legend. (d) Model prediction of effect of INaP conductance (gNaP) on RMP shows that increasing gNaP causes a cell in depolarization block (red) to further depolarize but has no effect on the RMP of a hyperpolarized, silent cell (black).

