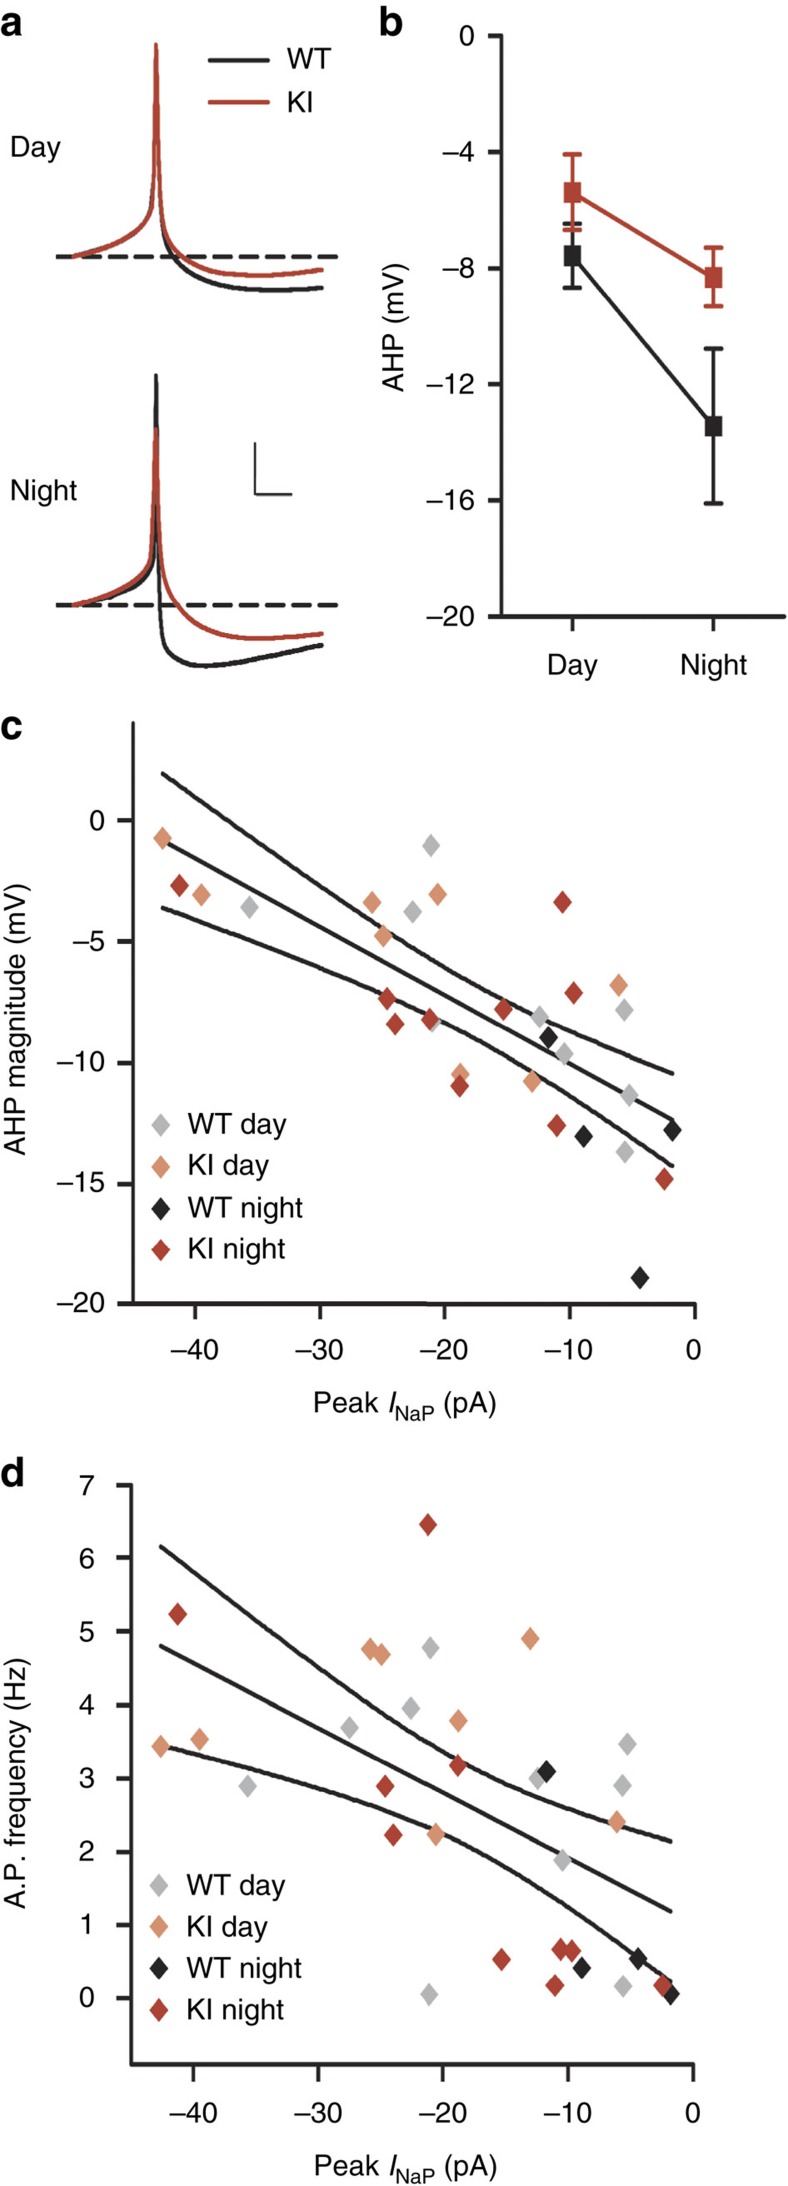
Figure 8. GSK3 decreases the AHP magnitude through INaP.
(a) Average AP waveforms from spontaneously active SCN neurons from WT (black) or GSK3-KI (red) mice recorded in mid-day or early-night. For visualization, all waveforms were adjusted to same baseline (−40 mV, dashed line) before averaging. Scale bar, 10 mV, 10 ms (b) Mean±s.e.m. of AHP magnitude (difference from RMP) from cells represented in a. AHP amplitude was significantly decreased during the day and in GSK3-KI cells. Two-way ANOVA; main effect of time, F(1,30)=10.266, P=0.003; main effect of genotype, F(1,30)=7.085, P=0.012. For a and b: n=4–11 cells, three animals per group. (c) Amplitude of AHP and peak INaP of spiking cells from all groups are significantly correlated. Pearson correlation, R=−0.732, P<0.001. Symbol colour indicates group as indicated in the legend. Lines represent linear fit and 95% confidence intervals of all cells in plot. (d) Spontaneous AP frequency and peak INaP of spiking cells from all groups are significantly correlated. Pearson correlation, R=−0.550, P=0.001. Lines represent linear fit and 95% confidence intervals for all cells in plot. For c and d: n=4–10 cells per group.

