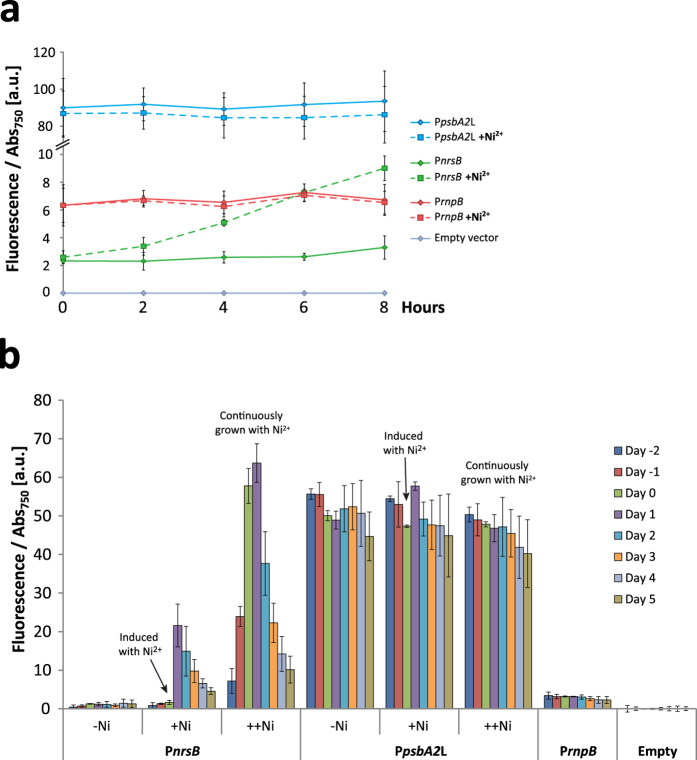
Figure 3. Promoter driven EYFP signal change over time.
Promoter activity measured as EYFP fluorescence per Abs750. (a) All strains were induced with 2.5 μM at 0 hours and measured every second hour. (b) The fluorescence of strains with and without induction was measured for eight days. The PnrsB and PpsbA2L strains were either grown in BG11 (−Ni), with addition of 2.5 μM Ni2+ at day 0 (+Ni) or grown continuously with 2.5 μM Ni2+ (++Ni). PrnpB and the empty vector strain were grown in BG11 without Ni2+. The fluorescence of the empty vector control strain was subtracted from each sample for each day or hour. Error bars represent SD (n = 4).

