
Figure 6. Promoter activities in E. coli.
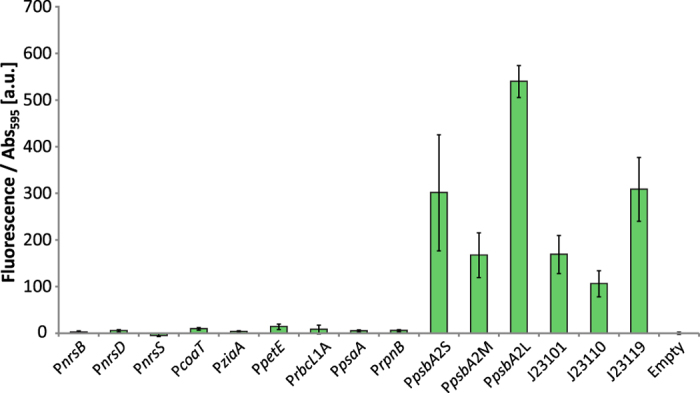
Promoter activities measured as fluorescence per Abs595. The fluorescence of the empty vector control strain was subtracted from each sample. Error bars represent SD (n = 6).
Official websites use .gov
A
.gov website belongs to an official
government organization in the United States.
Secure .gov websites use HTTPS
A lock (
) or https:// means you've safely
connected to the .gov website. Share sensitive
information only on official, secure websites.
Promoter activities measured as fluorescence per Abs595. The fluorescence of the empty vector control strain was subtracted from each sample. Error bars represent SD (n = 6).