
Figure 6.
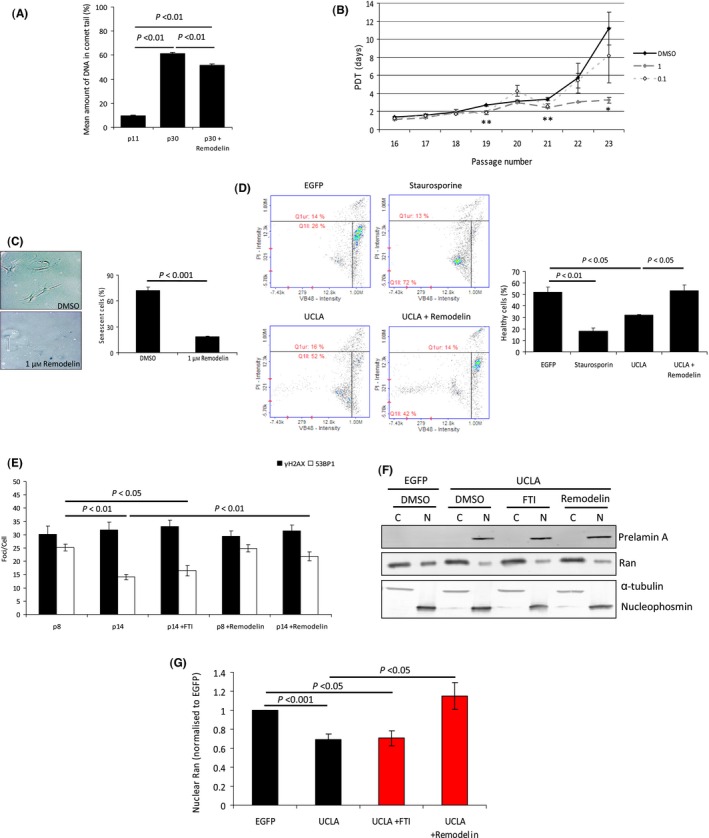
Remodelin improves cell fitness of late passage VSMCs and improves Ran gradient defects associated with prelamin A expression. (A) Comet assay of p12, p30 and p30 + Remodelin VSMCs. n > 100 cells per group were analysed from 4 independent experiments. Standard errors are shown. (B) Cell population doubling time (PDT) analysis of mid–late passage VSMCs treated with DMSO, 1 or 0.1 μm Remodelin. No differences were detected between DMSO and 0.1 μm Remodelin‐treated cells, but 1 μm Remodelin‐treated cells retained low PDTs for longer and grew significantly faster at passages 19, 21 and 23 (*P < 0.05, **P < 0.01). Data were from 3 independent experiments. (C) (Left) Representative image of senescence‐associated β‐galactosidase assay of p23 VSMCs treated with DMSO or 1 μm Remodelin from PDT experiment shown in B. Senescent cells are indicated by blue staining. (Right) Quantification of senescent cells. A minimum of 200 cells were counted from 3 experiments. (D) Cell vitality analysis of p11 VSMCs expressing EGFP, UCLA or UCLA+Remodelin. As a positive control for apoptosis initiation, cells were treated with Staurosporine. (Left) Representative plots from assay. (Right) Quantification of healthy cells from 3 independent experiments. (E) Enumeration of γH2AX and 53BP1 foci in p8 and p14 VSMCs treated with etoposide and −/+ FTI or Remodelin. Counts were from >200 cells from 3 independent experiments. (F) Representative WB of cytoplasmic (C) and nuclear (N) fractions from p10 VSMCs expressing EGFP or UCLA and treated with DMSO, FTIs or Remodelin. Prelamin A expression reduces levels of nuclear Ran, and this can be recovered to an extent by Remodelin. (G) Quantification of Ran band intensities shown in G. Measurements were taken from 3 separate experiments. Standard errors are shown. Bars in red indicate additional data added to data presented in Fig. 3A.