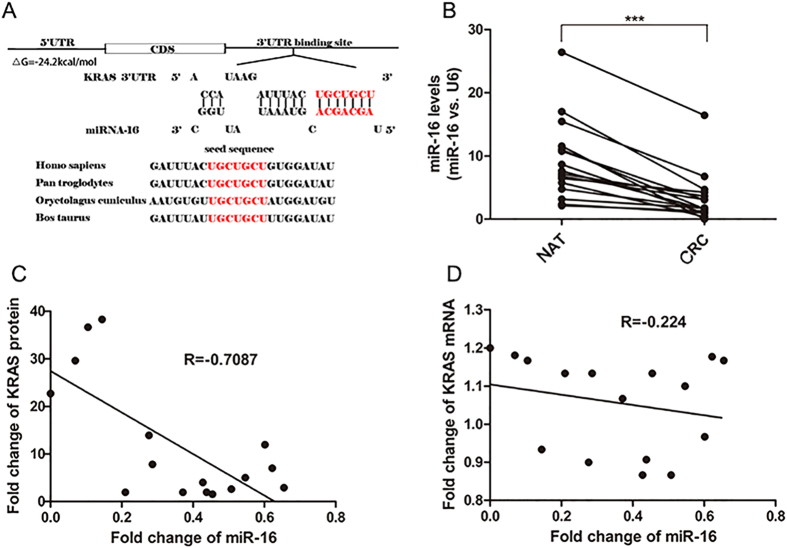
Figure 2. Prediction of KRAS as the target of miR-16.
(A) Schematic description of the hypothetical duplexes formed by the interactions between the binding site in the KRAS 3′-UTR (top) and miR-16 (bottom). The seed region of miR-16 and the seed-recognizing site in the KRAS 3′-UTR are indicated in red, and all nucleotides in seed-recognizing site are completely conserved in several species. The predicted free energy value of the hybrid is indicated. (B) Quantitative RT-PCR analysis of the miR-16 expression levels (miR-16 vs. U6) in the same 16 pairs of CRC and NAT samples. (C) Pearson’s correlation scatter plot of the fold change of miR-16 and KRAS protein in CRC samples. (D) Pearson’s correlation scatter plot of the fold change of miR-16 and KRAS mRNA in CRC samples. (mean ± S.D.; ***p < 0.001).

