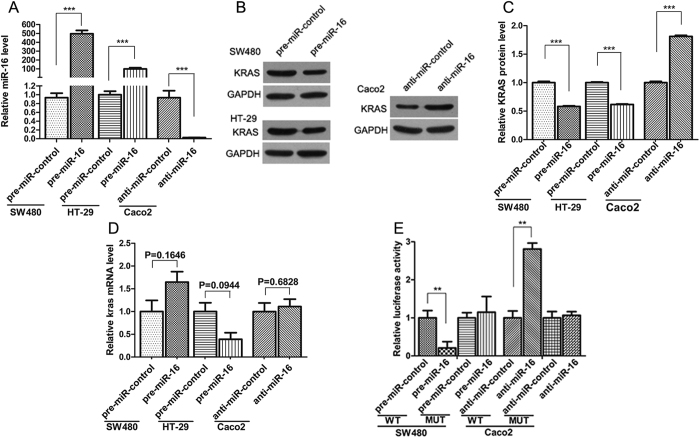
Figure 3. KRAS is a direct target of miR-16.
(A) Quantitative RT-PCR analysis of the miR-16 expression levels in SW480 and HT-29 cells that were transfected with pre-miR-16 or pre-miR-control and in Caco2 cells that were transfected with anti-miR-16 or anti-miR-control for 24 h. (B and C) Western blot analysis of the KRAS protein levels in SW480 and HT-29 cells that were transfected with pre-miR-16 or pre-miR-control and in Caco2 cells that were transfected with anti-miR-16 or anti-miR-control for 48 h. B: representative image; C: quantitative analysis. (D) Quantitative RT-PCR analysis of the KRAS mRNA expression levels in SW480 and HT-29 cells that were transfected with pre-miR-16 or pre-miR-control and in Caco2 cells that were transfected with anti-miR-16 or anti-miR-control for 24 h. (E) Direct recognition of the KRAS 3′-UTR by miR-16. Firefly luciferase reporters containing either the wild-type (WT) or mutant (MUT) form of the human KRAS 3′-UTR were co-transfected into SW480 cells along with pre-miR-16 or pre-miR-control, or into Caco2 cells along with anti-miR-16 or anti-miR-control. At 24 h post-transfection, the cells were assayed using a luciferase assay kit. Firefly luciferase values were normalized to β-gal activity and plotted as relative luciferase activity. For comparison, the luciferase activity in pre-miR-control-transfected and anti-miR-control-transfected cells was set as 1. (mean ± S.D.; **p < 0.01; ***p < 0.001).

