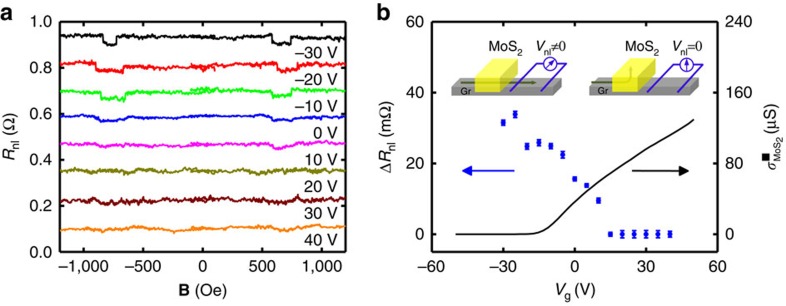
Figure 3. Spin transport in a graphene/MoS2 lateral spin valve.
Measurements are done using the blue-coloured circuit diagram in Fig. 1a. (a) Non-local resistance Rnl measured as a function of the magnetic field B at different Vg at 50 K using 10 μA current bias and for a centre-to-centre distance between ferromagnetic electrodes (L) of 1.8 μm. Individual sweeps are offset in Rnl for clarity. (b) Gate modulation of the spin signal ΔRnl (blue circles). The black solid line is the sheet conductivity of the MoS2 as a function of Vg. The insets show schematically the spin current path (green arrow) in the OFF state (left inset) and the ON state (right inset) of MoS2. Error bars are calculated using the s.e. associated with the statistical average of the nonlocal resistance in the parallel and antiparallel states.

