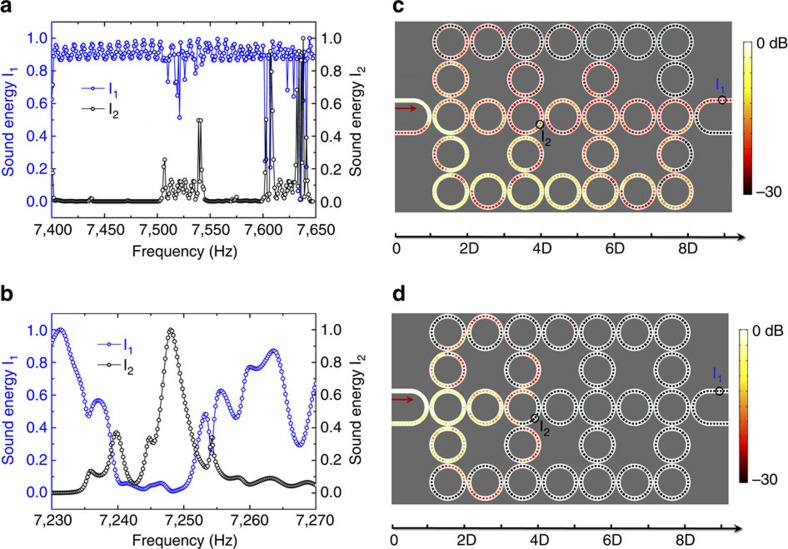
Figure 6. The measured sound energy spectra and sound energy distributions of pass band and band gap states.
(a,b) The measured sound energy spectra in the frequency ranges of 7.4∼7.65 kHz and 7.23∼7.27 kHz, respectively. In the experiments, we measured the sound energy spectra (I1 and I2) at two different sites, as marked by the circles in c,d (also see Supplementary Fig. 10). I1 and I2 are normalized with respect to their maxima (arb. unit). In light of the amplitudes of I1 and I2, we can clearly observe the bandwidths of gapless edge states, pass bands, as well as band gaps. (c,d) The measured sound energy distributions in the pass band (7.526 kHz) and the band gap (7.247 kHz), respectively.

