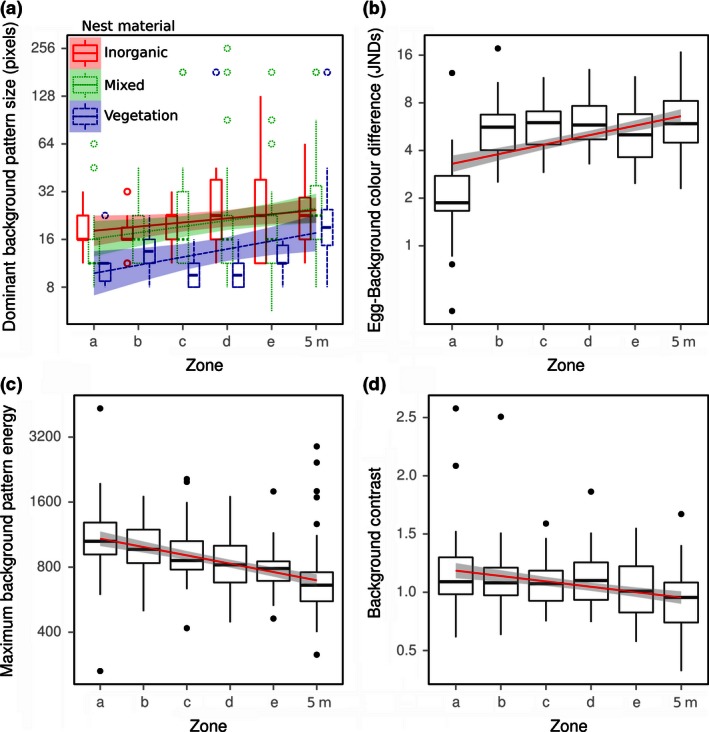
Figure 3.

Boxplots showing the camouflage metrics found to vary significantly with distance from the nest. Regression lines also show standard error (shaded region). Zones “a” to “e” are concentric rings increasing in distance from the center of the nest, and the final zones (“5 m”) are control images taken 5 m from each nest
