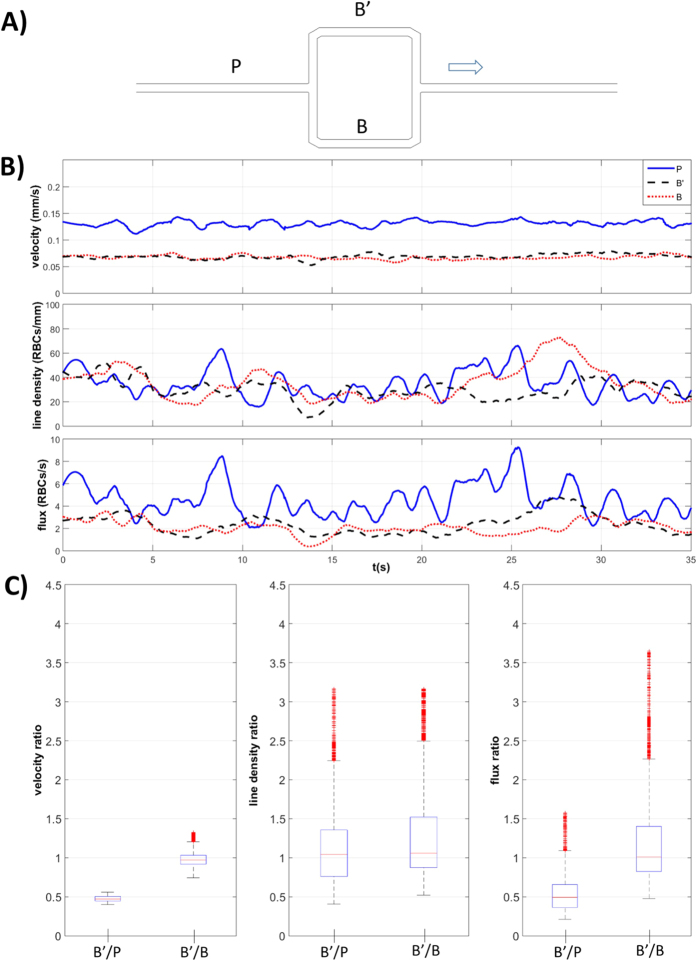
Figure 3. Phase separation results for the symmetric model.
(A) Schematic of the symmetric model: the two branches B’ and B are identical. The arrow indicates the direction of flow. (B) RBC velocity, line density and flux determined using the PTV algorithm, at perfusion pressure ΔP2 = 1 cmH2O, for the parent vessel (continuous line) and for the two daughter branches (dashed lines) and (C) boxplots of the respective ratios: B’/P and B’/B.

