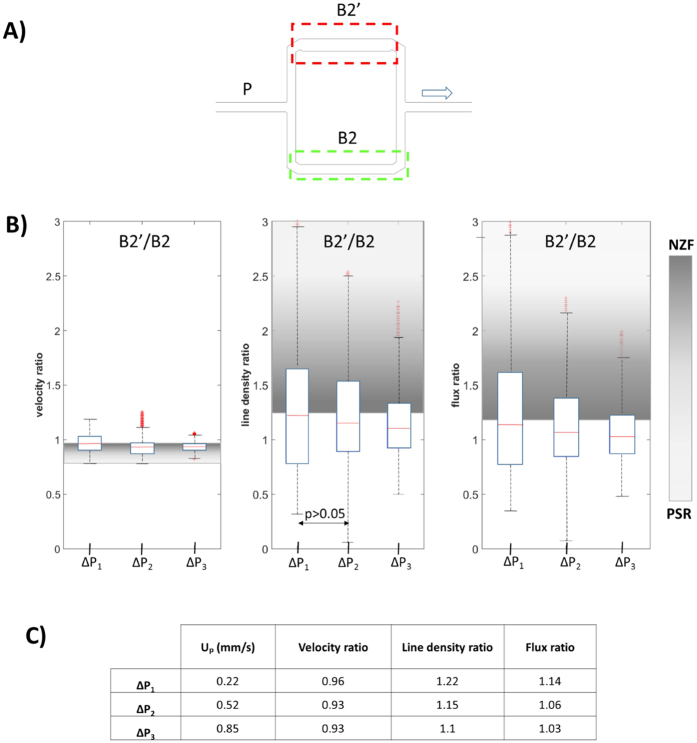
Figure 5. Effects of inflow rate on phase separation in dilated model.
(A) Dilated model: schematic of the asymmetric network with the dilated segment B2′ in branch B’. The arrow indicates the direction of flow. Red and green dashed rectangles indicate the two regions of interest (ROI). (B) Boxplots of the ratios of RBC velocity, line density and flux are of segments B2′ and B2 for different perfusion pressures ΔPi. The shaded areas indicate the range between the no-Zweifach-Fung condition (dark grey, NZF) and perfectly self-regulated situation (light gray, PSR). (C) Table of median values of the ratios shown in panel B as function of ΔP. Up indicates the average velocity estimated for the parent vessel.

