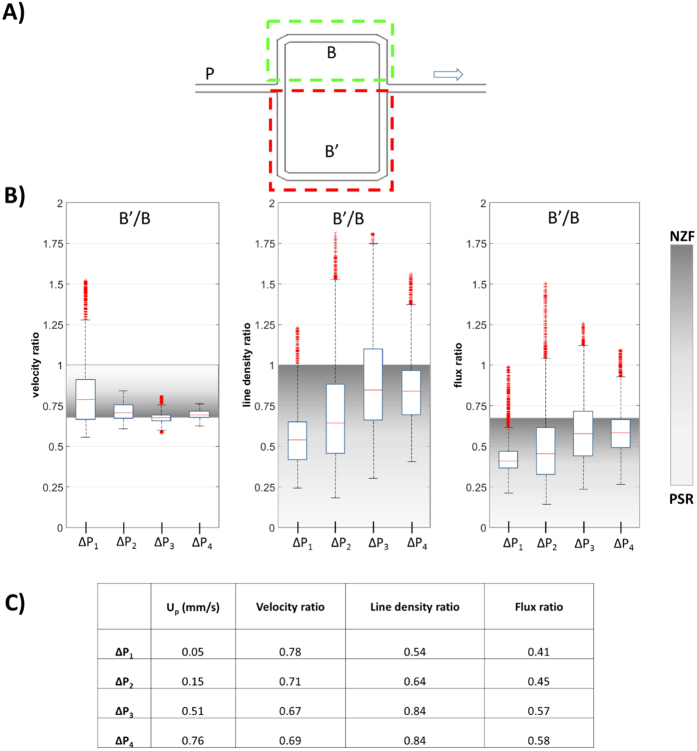
Figure 6. Effects of inflow rate on phase separation in stretched model.
(A) Schematic of the stretched model with branch B’ (ROI: red dashed rectangle) longer than branch B (ROI: green dashed rectangle). The arrow indicates the direction of flow. (B) Boxplots of the rations of RBC velocity, line density and flux of branches B’ and branch B for different perfusion pressures ΔPi. The shaded areas indicate the range between the no-Zweifach-Fung condition (dark grey, NZF) and perfectly self-regulated situation (light gray, PSR). (C) Table of median values of the ratios shown in panel B as function of ΔP. Up indicates the average velocity estimated for the parent vessel.

