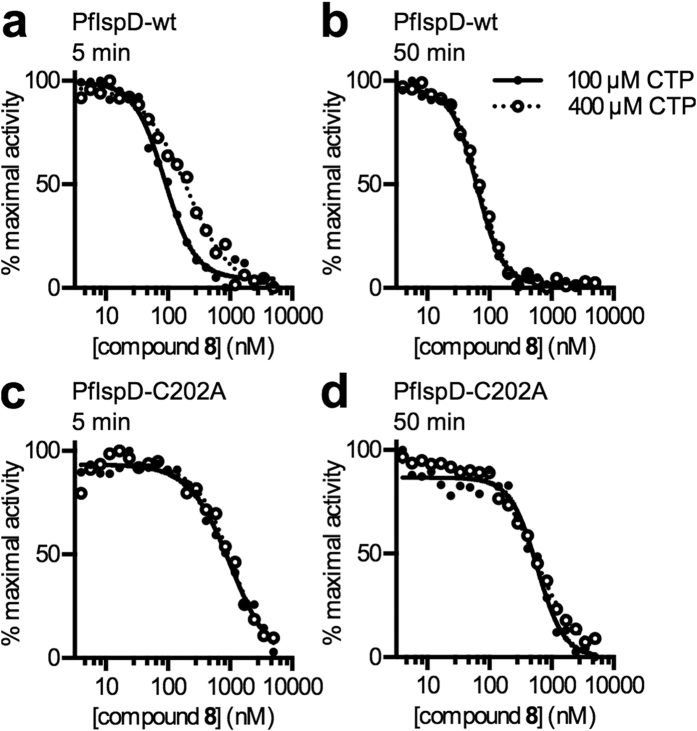
Figure 8. Inhibition of recombinant PfIspD enzymes.
(a) Treatment of PfIspD-wt with 8 at varying CTP concentrations shows the concentration of CTP substrate affects the strength of inhibition at early time points. Five min. IC50 values gave 120 ± 17 nM at 100 μM CTP and 330 ± 57 nM at 400 μM CTP; p = 0.04. Representative data shown; n ≥ 3. (b) Treatment of PfIspD-wt with 8 at varying CTP concentrations shows the concentration of CTP substrate does not affect the strength of inhibition following extended incubation. 50 min. IC50 values gave 49 ± 7.6 nM at 100 μM CTP and 81 ± 13 nM at 400 μM CTP; p = 0.17. Representative data shown; n ≥ 3. (c) Treatment of PfIspD-C202A with 8 at varying CTP concentrations shows the concentration of CTP substrate does not affect the strength of inhibition at early time points. Five min. IC50 values gave 660 ± 130 nM at 100 μM CTP and 860 ± 120 nM at 400 μM CTP; p = 0.32. Representative data shown; n ≥ 3. (d) Treatment of PfIspD-C202A with 8 at varying CTP concentrations shows the concentration of the CTP substrate does not affect the strength of inhibition following extended incubation. 50 min. IC50 values gave 414 ± 86 nM at 100 μM CTP and 470 ± 39 nM at 400 μM CTP; p = 0.57. Representative data shown; n ≥ 3.

