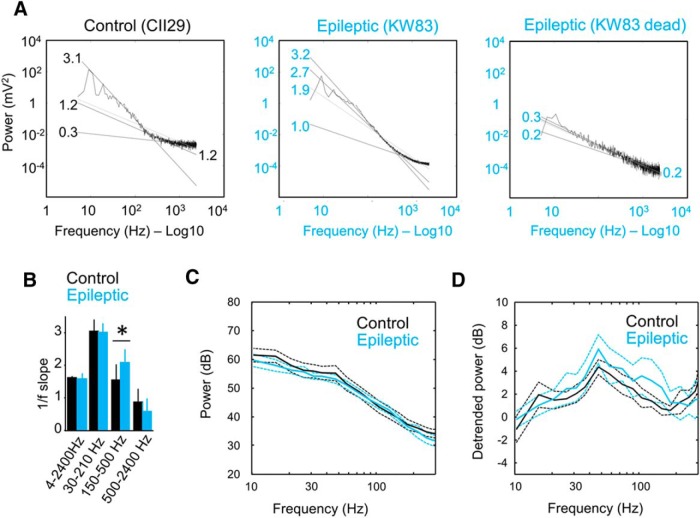
Figure 1.
Correction for 1/fn to evaluate group differences across different gamma bands. A, The typical 1/f trend of the power spectrum complicates the examination of a range of gamma activity from 30 to 150 Hz. Representative spectrum from LFP at the SLM from a control and an epileptic rat is shown to exemplify the issue. The codes of the rats are given in parentheses. The factor n better fits the 1/f power law change for different frequency bands. Numbers at fitting lines identify the n factor for different bands in the examples shown (4–2400, 30–210, 150–500, and 500–2400 Hz). Note the fitting consistency between bands when no biological activity is recorded (dead condition for the epileptic rat; rightmost plot). B, Group differences of the n scale factor for different frequency bands. Note the similarities between control and epileptic rats, except for the 150–500 Hz high-frequency band. *p < 0.05. C, Mean group power spectrum (±95% confidence interval) from SLM channel of all control rats (n = 10) and epileptic rats (n = 8). Note the occurrence of some spectral trends across gamma bands but poor difference between groups due to 1/f scaling. D, Same data as in C after power law detrending between 30 and 210 Hz. Note the differences between groups.

