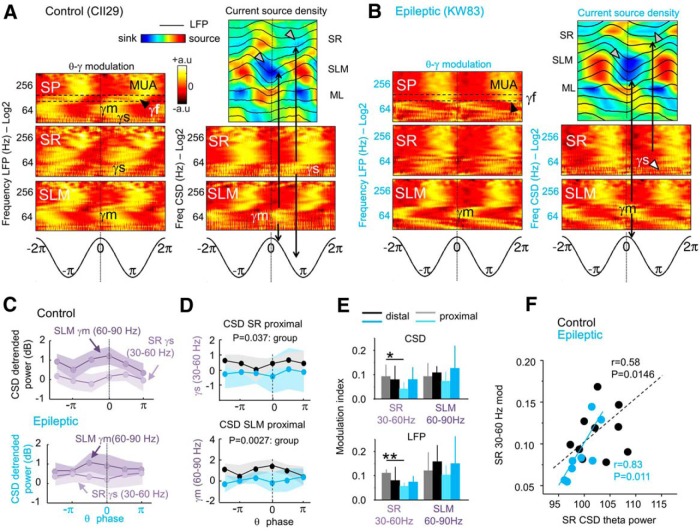
Figure 3.
Theta-phase modulation of gamma activity. A, Representative example of theta–gamma modulation recorded from the control rat shown in Figure 2C. Theta-phase modulation of LFP gamma activity is shown at left for SP, SR, and SLM channels (black-yellow plots). CSD signals help to account for local gamma generators (blue-red plot at right). Theta-phase modulation of CSD gamma activity is shown below the CSD plot for SR and SLM channels. All signals are aligned by the theta peak recorded at SP (vertical discontinuous line). Note the clear theta-phase segregation of the slow and mid-gamma bands from MUA recorded at the SP. Gamma-s (γs) CSD activity (30–60 Hz) is better isolated at the SR during the descending phase of theta cycles in association with the corresponding SR theta sink (vertical arrows). Gamma-m (γm) CSD activity (60-90 Hz) is isolated at the SLM during the SP theta peak, in association with the corresponding SLM sink. SR and SLM sinks are indicated by gray arrowheads in the CSD plot. B, Same as in A for the epileptic rat shown in Figure 2C. Note the poor slow activity compared with the control rat. C, Phase difference between the SR and SLM CSD signals in all control (top plot, n = 10) and epileptic rats (bottom plot; n = 8). Note the poor modulation of SR slow gamma in epileptic rats (only data from six phases are shown). D, Group differences of the SR slow and SLM mid-gamma CSD generators were found only at proximal locations. The p values refer to group effects in a two-way ANOVA for groups and four phases. E, Differences of the gamma modulation index between groups were found only in the slow 30–60 Hz band at proximal locations both for LFP and CSD signals. *p < 0.05; **p < 0.005. F, Correlation between the LFP slow gamma modulation index at SR and the theta power of the SR CSD signal for both groups together (black) and within the epileptic group (blue).

