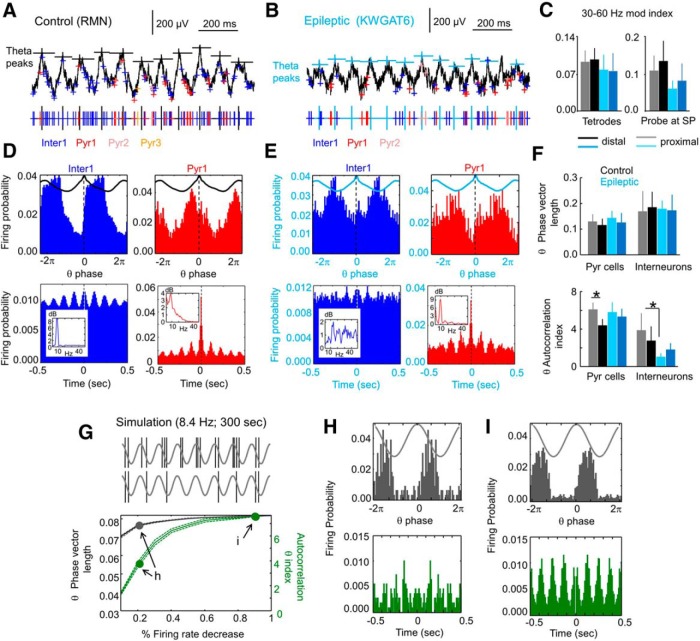
Figure 6.
Disruption of interneuronal firing patterns at the proximal CA1 of epileptic rats. A, Representative tetrode recording from a control rat (only one channel is shown). Spikes from individually sorted pyramidal cells and one interneuron are shown in different colors. Large black ticks mark the position of theta peaks at SP. B, Same as in A for an epileptic rat. C, Proximodistal group differences (mean ± SD) of slow gamma modulation index as obtained from tetrodes (eight proximal and eight distal from three control rats, and six proximal and six distal from three epileptic rats) and silicon probes (four proximal and five distal from nine control rats; and three proximal and three distal from six epileptic rats). Different degree of spike contamination in tetrode and silicon probe recordings likely prevents a quantitative comparison between these datasets. D, Theta phase-locked firing (top row) of the interneuron and pyramidal cell shown in A. Firing phase modulation (8.7º bin size) was quantified using the theta-phase vector length. Bottom histograms represent the unit firing autocorrelograms (1 ms bin size). Insets show the power spectrum of the unit autocorrelogram, from which a theta autocorrelation index was estimated. This interneuron was subclassified as a putative PV basket cell (Table 1, unit 0405RMN_OF_T1R-01_part1_1). E, Same as in D for the interneuron and pyramidal cell shown in the epileptic rat in B. The putative interneuron could not be quantitatively subclassified, but it resembled an OLM interneuron (Table 1, unit 2911KWGAT6_OF_1_btp_01_T5R15-03_3). F, Group data (mean ± SD) for the theta-phase vector length (top plot) and the theta autocorrelation index (bottom) for all units. Note differences between groups concentrated at the autocorrelation index for proximal interneurons. *p < 0.05. G, Computer simulation of theta phase-locked firing with different degrees of firing rate (mean ± SD from 100 simulations). Decreasing the global firing rate had a stronger impact in the autocorrelation index than in the phase vector length, indicating different sensitivity of these measures. Arrows point to simulations shown at left. H, I, Data from simulations indicated by arrows in G. Both the theta-phase histograms (top row) and the autocorrelograms (bottom) are shown. Note poor rhythmicity in the autocorrelogram but not apparent change in theta-phase firing preference when the global firing rate decreases to <20%.

