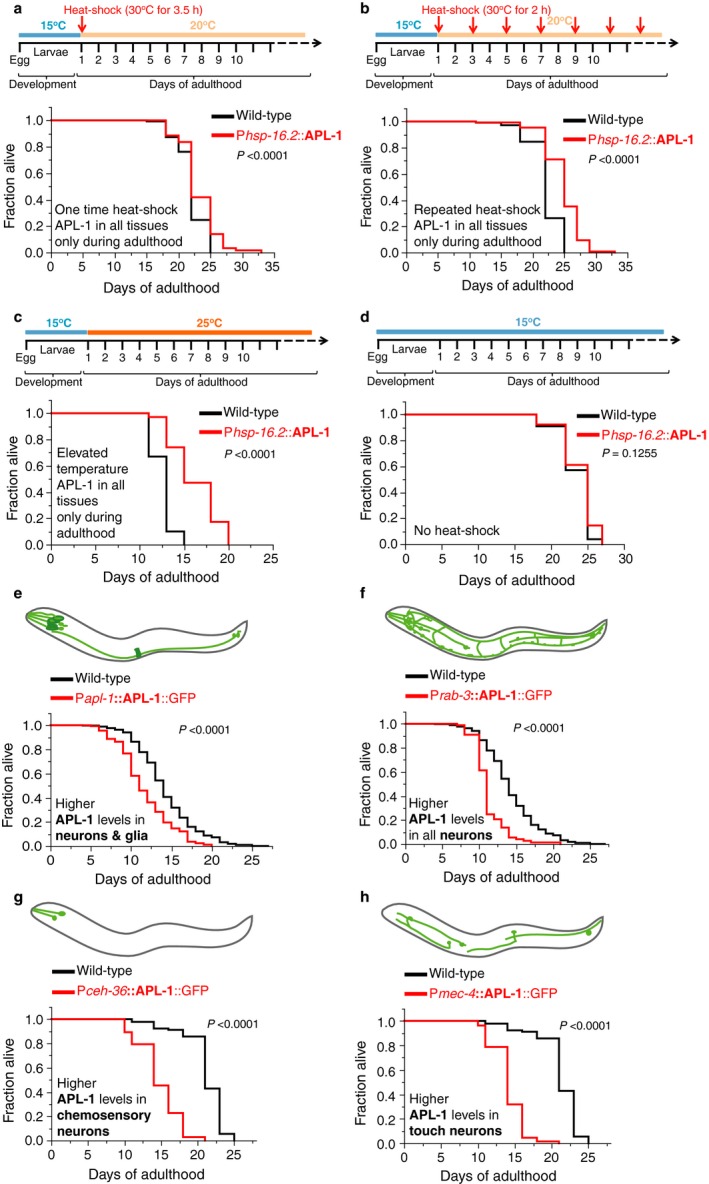
Figure 1.

Overexpression of APL‐1 in all tissues during adulthood is sufficient to increase lifespan. (a–d) Wild‐type (N2) and transgenic ynIs14 [Phsp‐16.2::APL‐1] animals that express APL‐1 driven by a heat‐shock promoter (Phsp‐16.2) were maintained at 15°C and shifted to different temperatures as indicated in the schematics. (a) A single heat shock during early adulthood was sufficient to increase the lifespan of ynIs14 [Phsp‐16.2::APL‐1] animals. (b) Repeated heat shocks every other day during adulthood robustly increased the lifespan of ynIs14 [Phsp‐16.2::APL‐1] animals. (c) Elevated temperatures were sufficient to drive APL‐1 expression from hsp‐16.2 promoter (not shown; G. O'Connor, personal comm.) and increased lifespan of ynIs14 [Phsp‐16.2::APL‐1] animals. (d) At lower temperatures, the hsp‐16.2 promoter does not drive APL‐1 expression. The lifespan of ynIs14 [Phsp‐16.2::APL‐1] animals was not extended. (e–h) Overexpression of APL‐1 with cell‐specific promoters and its own promoter in wild‐type animals. (e) Pan‐neuronal APL‐1 overexpression of ynIs104 [Prab‐3::APL‐1::GFP] animals resulted in a shortened lifespan. (f) Transgenic ynEx214 [Pceh‐36::APL‐1::GFP] animals that overexpress APL‐1 in chemosensory neurons showed a shortened lifespan. (g) Transgenic ynIs113 [Pmec‐4::APL‐1::GFP] animals that overexpress APL‐1 in touch mechanosensory neurons showed a shortened lifespan. (h) Driving APL‐1 overexpression from its endogenous promoter results in higher APL‐1 levels in neurons, glia cells, and vulva muscles [Papl‐1::APL‐1::GFP]. Transgenic ynIs79 [Papl‐1::APL‐1::GFP] animals showed a shortened lifespan. For (a–d) Lifespan assays were run in parallel at the same time. P‐value was determined by log rank. Statistics and additional lifespan data are in Table S1. For (e–f). Lifespans are shown in cumulative form. For (e–h) Schematic representation of the expression pattern of APL‐1 with different promoters is from Ewald et al. (2012a>). Light green indicates neurons and dark green indicates other tissues. P‐value was determined by log rank. Statistics and additional lifespan data are in Tables S1 and S2.
