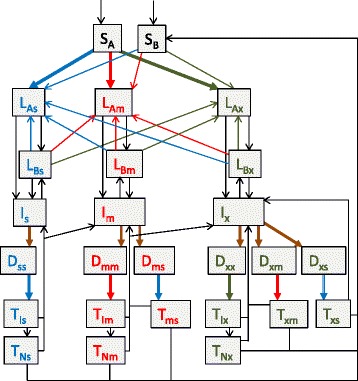
Fig. 1.

Model structure. Spontaneous recovery for patients in the detected compartments and all death flows are not depicted. Brown arrows represent case detection flows, the total of which are set equal for all strains. Hollow arrows represent treatment commencement flows, which are determined by the total number of persons awaiting treatment with that regimen and the availability of the regimen for each of the three regimens. Individual compartment names are explained in Additional file 1: Table S1 and summarised as follows: blue text and s subscript, drug-susceptible TB; red text and m subscript, multidrug-resistant TB; green text and x subscript, XDR-TB (including also MDR-TB strains with resistance to fluoroquinolones or second-line injectable agents). S, susceptible to TB (A and B subscripts refer to fully susceptible and partially immune, respectively); L, latent infection (A and B subscripts refer to early and late latent infection, respectively); I, active TB disease in the community not yet detected; D, detected (first subscript refers to the actual resistance pattern of the infecting strain, second subscript refers to the strain thought to be present at diagnosis); T, on treatment (subscripts are as for D compartments for those incorrectly diagnosed, while for those correctly diagnosed I subscript indicates still infectious on appropriate regimen, while N subscript indicates no longer infectious). For simplicity, the model assumes no Is patients are incorrectly detected as drug-resistant
