
Fig. 3.
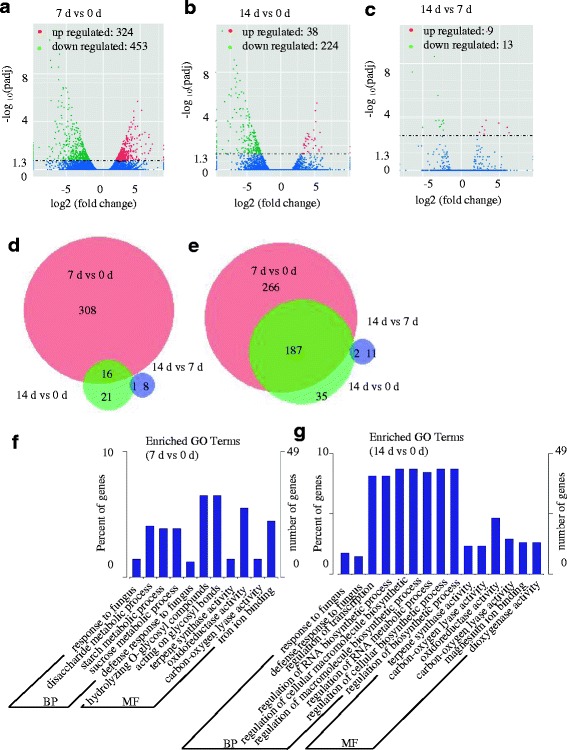
Analysis of the differentially expressed unigenes (DEGs) during the graft process in hickory. a-c) Volcanoplots of the DEGs in different comparisons. d, e VennDiagrams of the DEGs in different comparisons. f Gene Ontology (GO) classifications of DEGs in the Cc_7 D vs Cc_0 D comparison. g Gene Ontology (GO) classifications of DEGs in the Cc_14 D vs Cc_0 D comparison