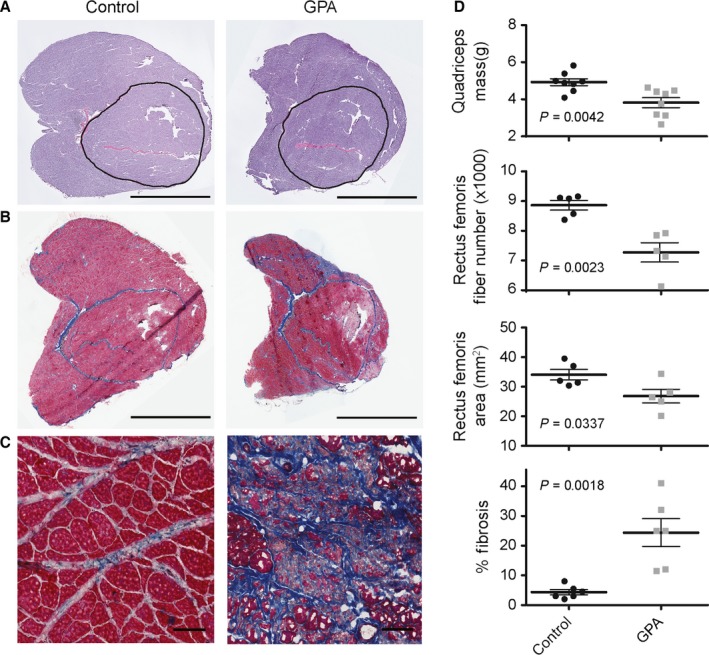
Figure 1.

Morphometric data from aged control and GPA‐treated rats. (A) Representative muscle cross‐sectional images stained with hematoxylin and eosin. The bar denotes 5 mm. The encircled area delineates the rectus femoris muscle with cross‐sectional areas of 39.5 and 33.2 mm2 for control and GPA treated, respectively. (B) Quadriceps muscle sections stained with Masson's trichrome to identify collagen (blue) deposition. The bar denotes 5 mm. (C) Higher magnification imaging of fibrotic tissue deposited in aged rats. The bar denotes 100 μm. (D) Quadriceps muscle mass, rectus femoris fiber number and cross‐sectional area, and quadriceps fibrotic tissue abundance in control and GPA‐treated aged rats.
