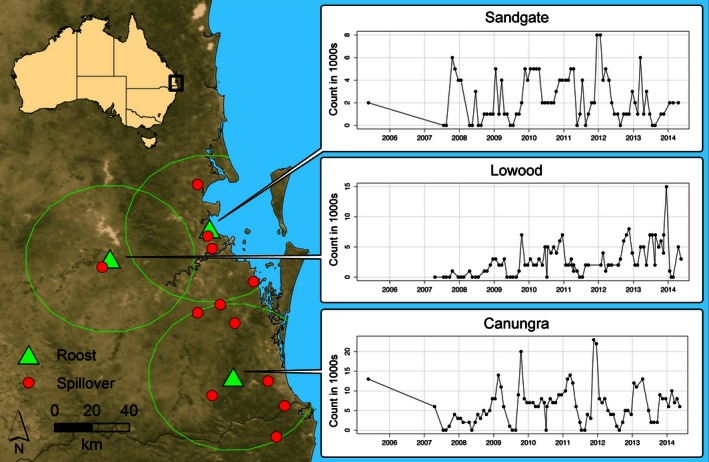
Figure 1.

A map of our study area in southeast Queensland showing locations for three analyzed roosts (green triangles), maximum foraging radius (40 km), and locations of spillover events (red circles) that have occurred within the foraging radius of each roost. Time series of census counts display the recorded population counts at each location.
