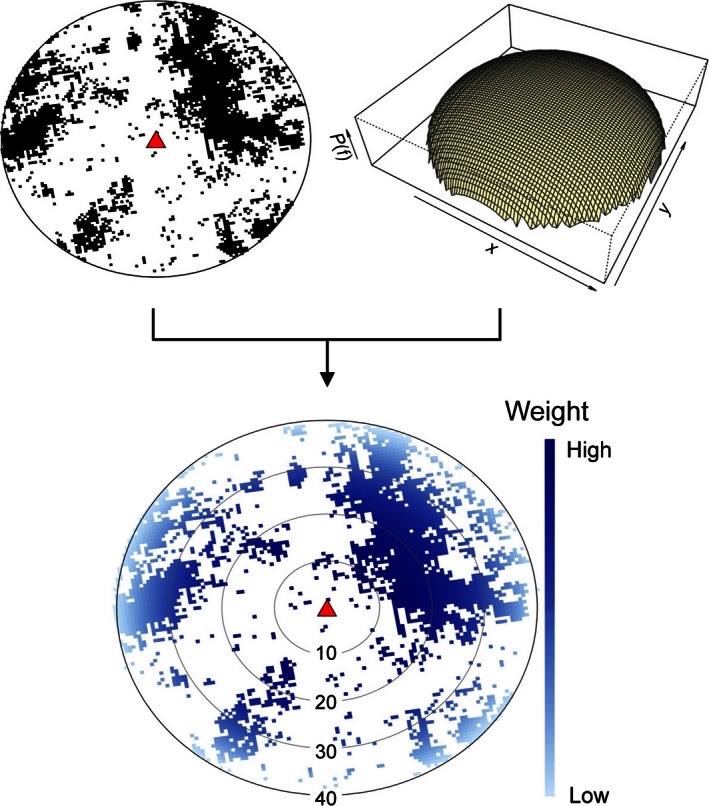
Figure 2.

Schematic of the spatial sampling algorithm, which takes a binary raster layer depicting areas containing diet plant species (circle with black pixels), and weights them according to a spatial kernel defined by a probability density function (perspective plot). The result is a spatially weighted sample within a constrained area (bottom circle with blue pixels showing the sampling weight).
