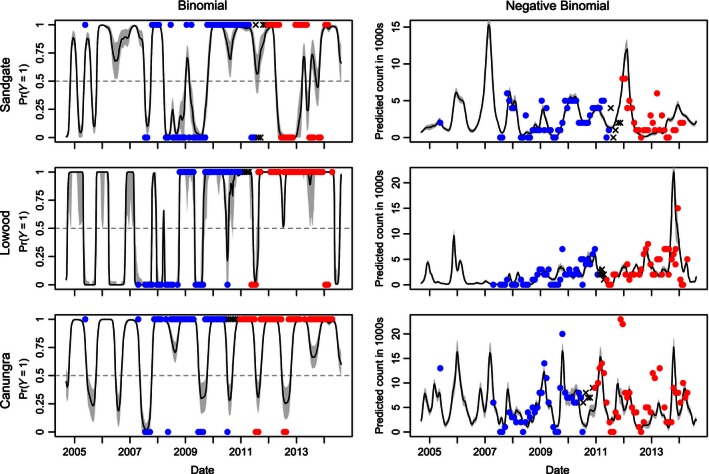
Figure 4.

Predictive performance of final selected models with a 50/50 training/testing split. Data points from the training set are displayed in blue, and data points from the test set are displayed in red with the points in the temporal spacer displayed as black exes. 95% bootstrapped confidence intervals are shown in gray.
