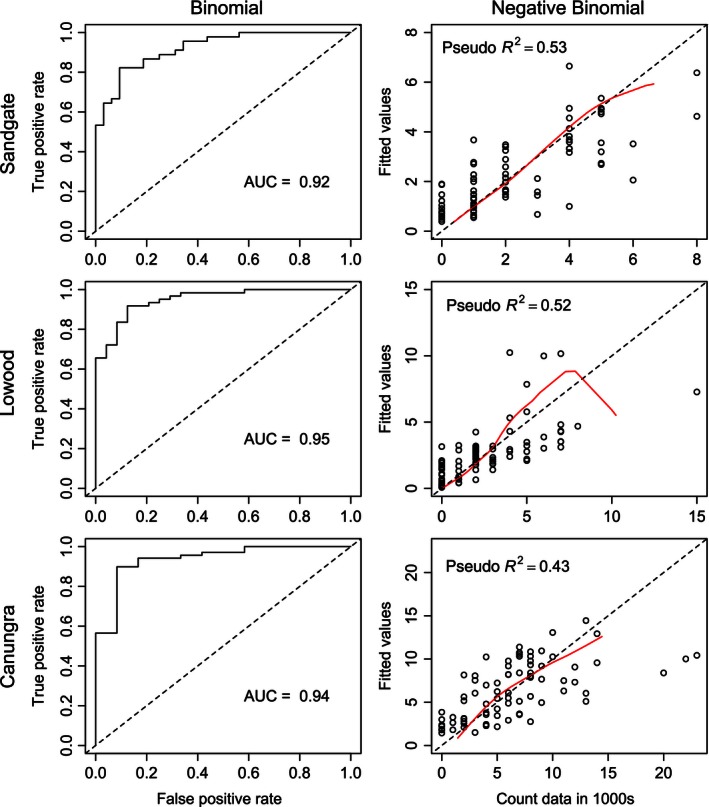
Figure 5.

Model performance metrics of final models fitted to all data. ROC curves and AUC shown on the left, and plots of fitted versus data values with Pseudo R 2 on the right. For additional model performance metrics, such as thresholds used to calculate classification accuracy and scaled residual plots, see Fig. S6.
