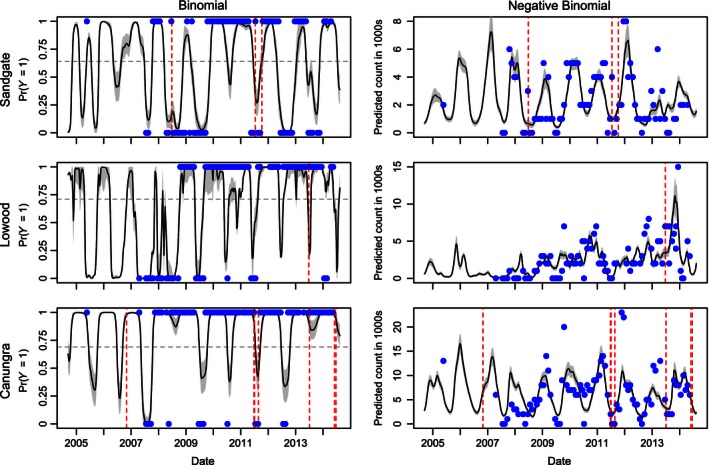
Figure 6.

Final models of bat population flux using all data points with the dates of spillover events that occurred within a 40 km foraging radius of each roost respectively shown as dotted red lines. 95% bootstrapped confidence intervals are shown in gray.
