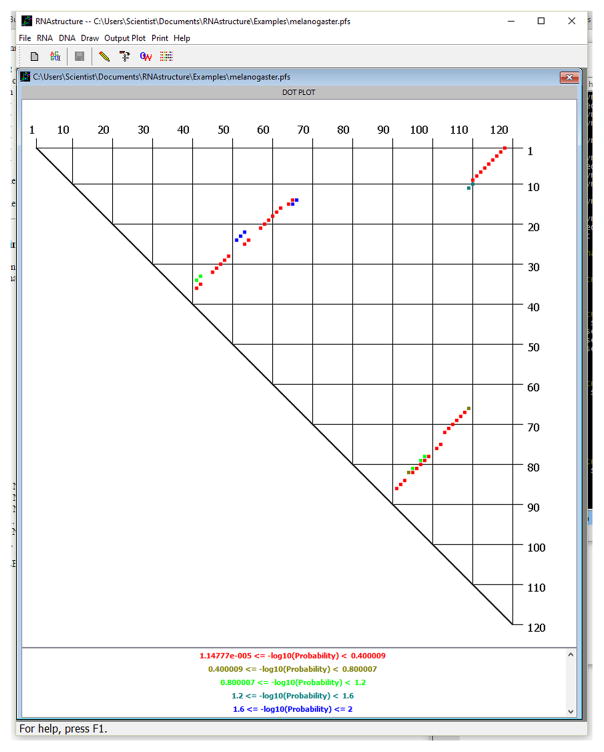
Figure 11.2.4.
The probability dot plot for base pairs in the D. melanogaster 5S rRNA sequence. Each dot in this plot is a single base pair and is associated with a base-pairing probability. For pairs between nucleotides i and j, with i < j, i is down the right-hand side of the plot and j is across the top. In RNAstructure, dots are colored to indicate a probability interval, with the most probable pairs in red and the least probable in blue. The current base pairs displayed have pairing probability of ≥1%. A color key is drawn at the bottom of the window (not shown in this view). After clicking on a dot, the pair and −log10(base-pair probability) are indicated at the bottom of the RNAstructure window. The current display shows that the base pair between G75 and C102 was clicked and has a −log10(base-pair probability) of 5.33232 × 10⁻² (88.4%). For a color version of this figure, see http://www.currentprotocols.com.

