Figure 1.

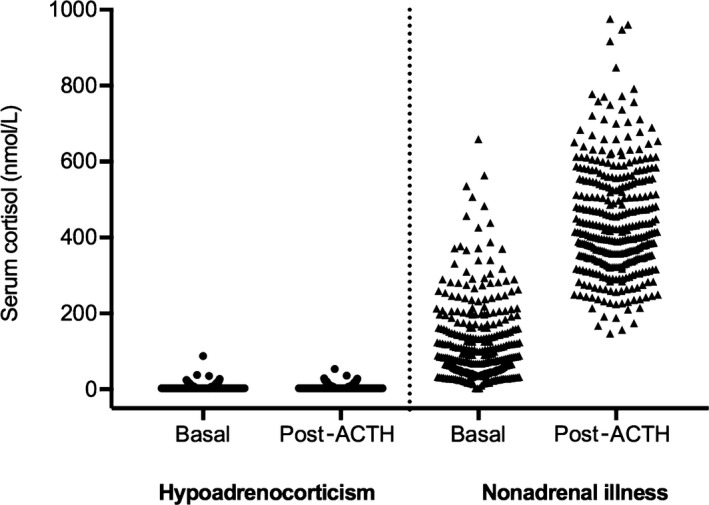
Scatter plot comparing basal and post‐ACTH‐stimulated serum or plasma cortisol concentrations (nmol/L) in dogs with hypoadrenocorticism (n = 163) and dogs with nonadrenal illness (n = 351).

Scatter plot comparing basal and post‐ACTH‐stimulated serum or plasma cortisol concentrations (nmol/L) in dogs with hypoadrenocorticism (n = 163) and dogs with nonadrenal illness (n = 351).