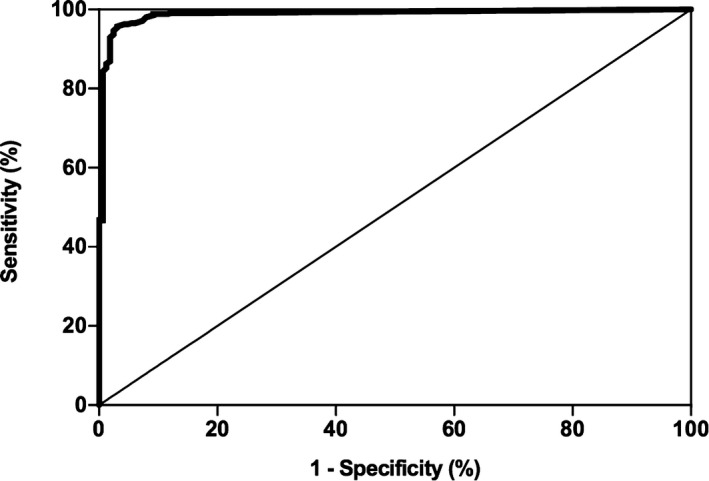
Figure 3.

Receiver operating characteristic (ROC) curve (dogs with hypoadrenocorticism versus dogs with nonadrenal illness) for serum or plasma basal cortisol concentrations for the diagnosis of hypoadrenocorticism. The thin diagonal line represents a completely uninformative test, wherein the area under the curve (AUC) is 50%. The area under the ROC curve represented by the thicker line is 98.8% (95% CI, 0.979–0.997). The overall most accurate cut‐point identified on the curve was 22 nmol/L, which had a sensitivity and specificity of 96.9 and 95.7%, respectively.
