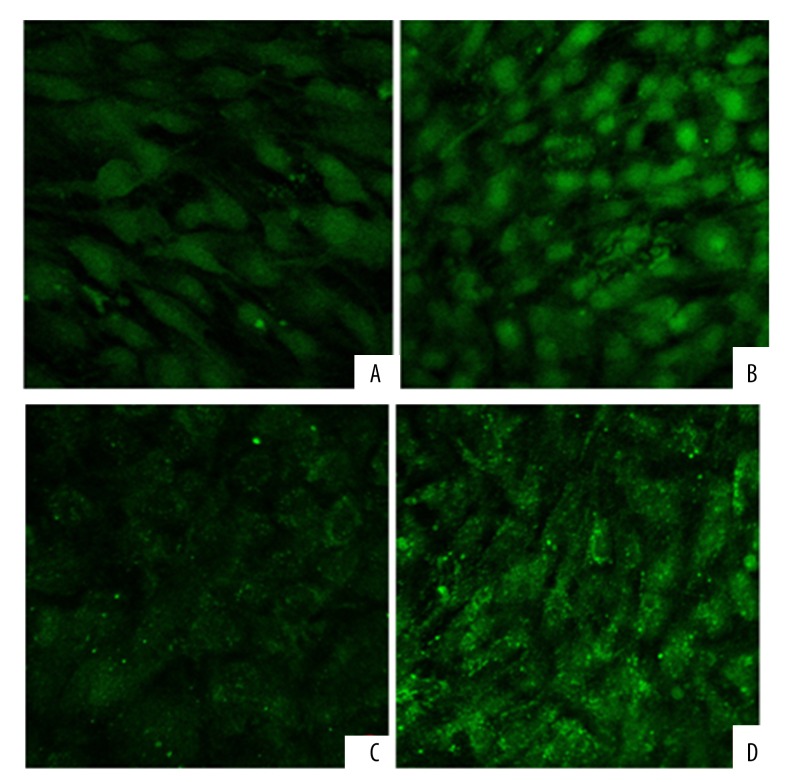
Figure 2.
The expression of type II collagen in BMSCs. The green fluorescence of type II collagen was significantly lower in the control group (A) than in the PTH-treated group (B). The expression of aggrecan in BMSCs. The green fluorescence of aggrecan was significantly lower in the control group (C) than in the PTH-treated group (D).

