Figure 5.
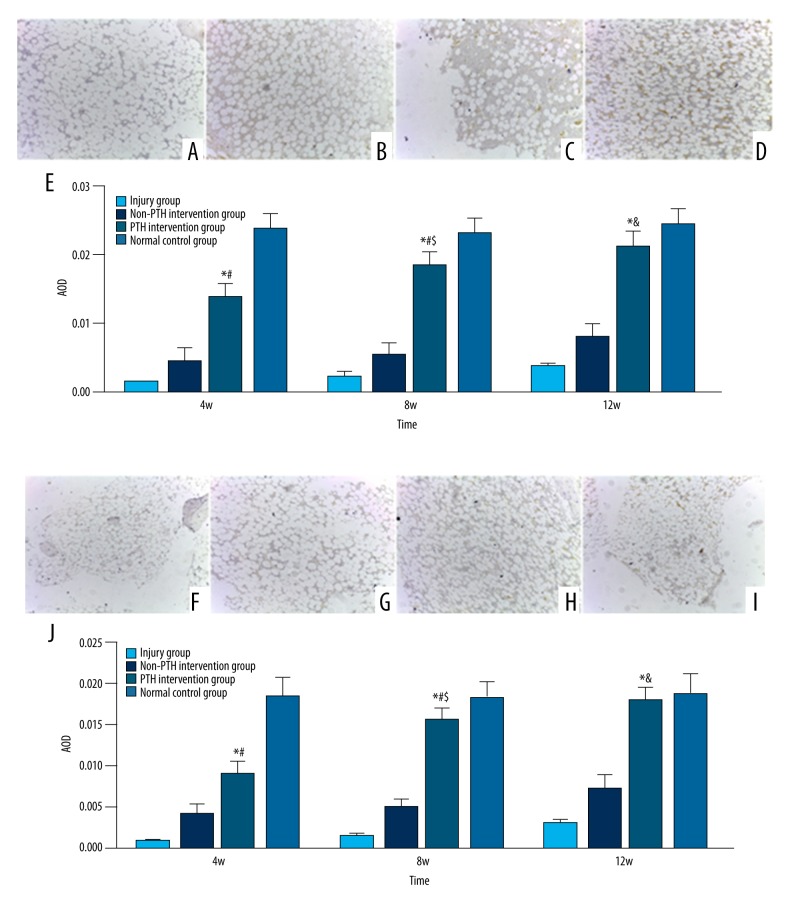
Type II collagen immunochistochemical detection of the postoperative 12w restoration tissue (×100 magnification); (A) for the injury group, the staining was negative; (B) for the non-PTH intervention group, the staining was positive, but it was weaker than the PTH intervention group; (C) for the PTH intervention group, the staining was positive, and it was close to the normal control group; (D) for the normal control group, the staining was the best positive. (E) The average optical density of type II collagen in different groups. All date were expressed as mean ± standard deviation, n=6; Compared with injury group or non-PTH intervention group, * p<0.005; Compared with normal control group, # p<0.05; Compared with PTH intervention group on the 4th week, $ p<0.05 or on the 8th week, & p<0.05. Aggrecan immunochistochemical detection of the postoperative 12w restoration tissue (×100 magnification); (F) for the injury group, the staining was negative; (G) for the non-PTH intervention group, the staining was positive, but it was weaker than the PTH intervention group; (H) for the PTH intervention group, the staining was positive, and it was close to the normal control group; (I) for the normal control group, the staining was the best positive. (J) The average optical density of aggrecan in different groups. All date were expressed as mean ± standard deviation, n=6; Compared with injury group or non-PTH intervention group, * p<0.005; Compared with normal control group, # p<0.05; Compared with PTH intervention group on the 4th week, $ p<0.05 or on the 8th week, & p<0.05.

