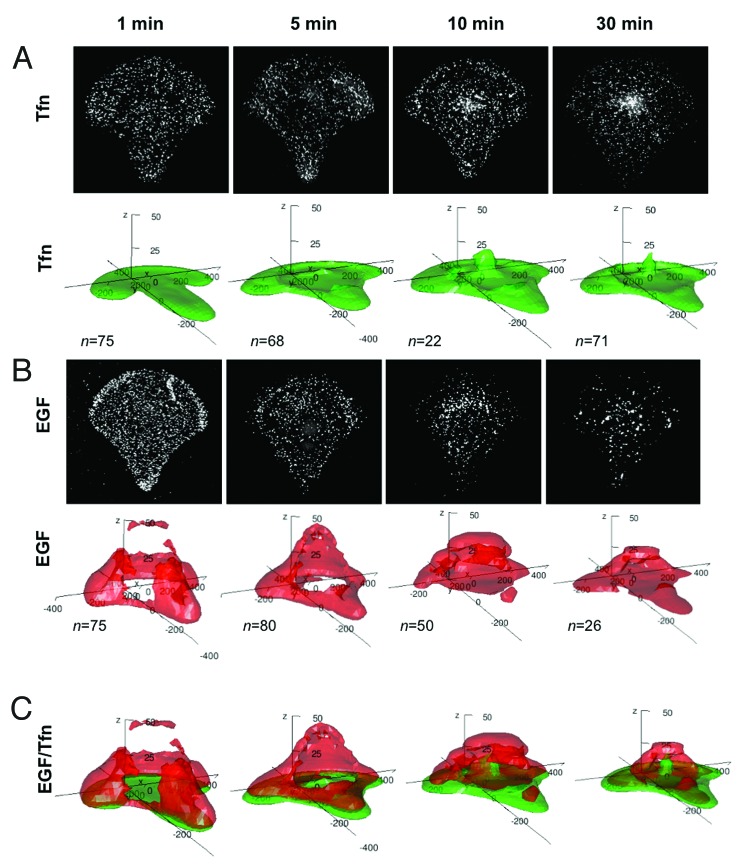
Figure 2. Uptake of transferrin (Tfn) and epidermal growth factor (EGF) in micropatterned cells. (A) Maximum intensity projection (MIP) of fluorescently marked Tfn in single crossbow-shaped micropatterned cells at 1 min, 5 min, 10 min and 30 min after ligand addition (upper panel) and corresponding 3D density maps of the 50% probability contour for n cells (lower panel). Density maps represent the smallest regions in which 50% of fluorescent structures are found. (B) MIP of fluorescently marked EGF in single crossbow-shaped micropatterned cells at 1 min, 5 min, 10 min and 30 min after ligand addition (upper panel) and corresponding 3D density maps of the 50% probability contour for n cells (lower panel). Density maps represent the smallest regions in which 50% of fluorescent structures are found. (C) Merged 3D density maps of fluorescently marked Tfn (green) and EGF (red) at different time points. For ease of visualization, the height (Z axis) has been stretched 5-fold.

An official website of the United States government
Here's how you know
Official websites use .gov
A
.gov website belongs to an official
government organization in the United States.
Secure .gov websites use HTTPS
A lock (
) or https:// means you've safely
connected to the .gov website. Share sensitive
information only on official, secure websites.
