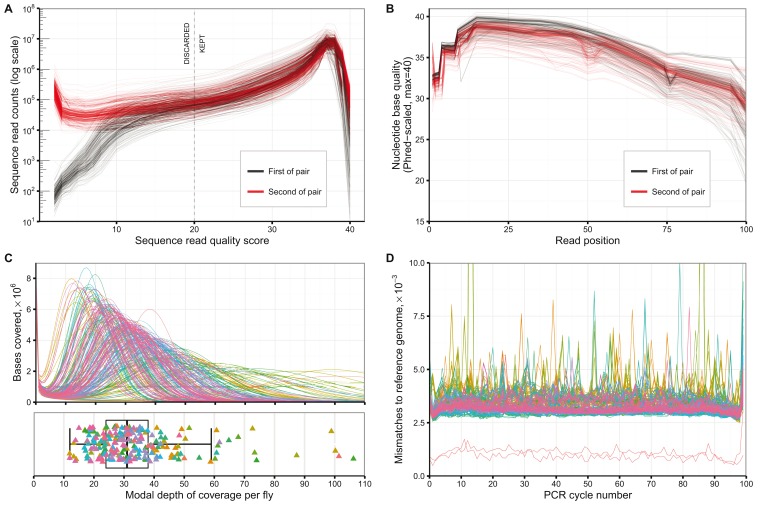
Figure 3. Next-generation sequencing assessment.
A: Sequence read quality for each sample sequenced. Y-axis scale is logarithmic. B: Quality of sequences by nucleotide base position for each sample. C: Read depth of coverage distribution across each sample. Colouring corresponds to the order which which the samples were originally sequenced. D: Mis-matches to the dm6 reference genome assembly, by PCR cycle-number. Colouring is by sample as in plot C. The two red lines with visibly-lower mismatch rates than the others correspond to the two in-house BDGP/dm6 reference lines that were sequenced. Data and R code for this figure are located at https://doi.org/10.5281/zenodo.159282.

