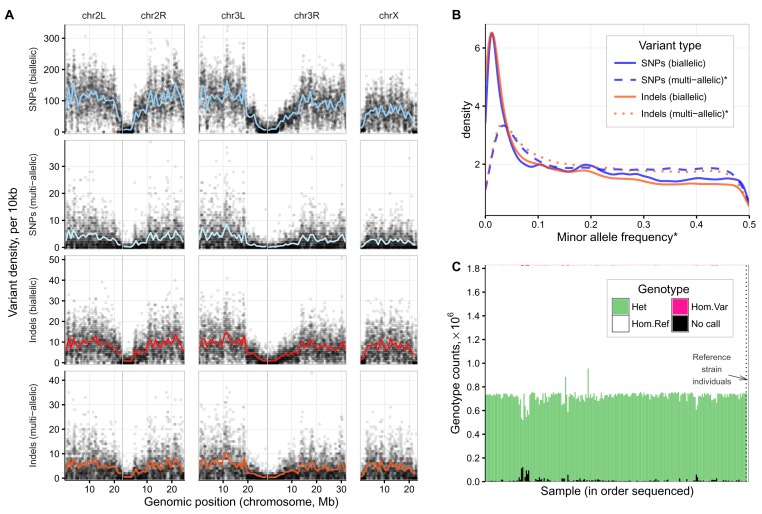
Figure 4. Haplotype Caller small variant results.
A: Density of common variants across the genome (MAF>0.05 (Variants from the in-house reference line are included but account for less than 3,686 of the 1,825,917 common variants plotted (<0.2%). B: Allele frequency distribution by variant type. *MAF values were calculated from the count of heterozygous calls, and so for multi-allelic variants, the MAF is derived from the combined count of both alternate alleles. C: Genotype counts per individual genotyped. Data generated using GATK/3.4 VariantEvaluation function. Data and R code for this figure are located at https://doi.org/10.5281/zenodo.159282.

