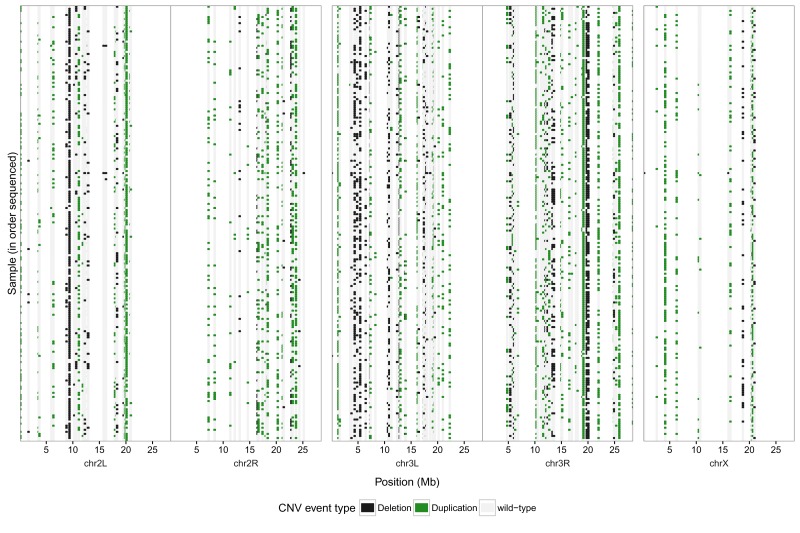
Figure 5. Genomestrip structural variant results across the D. melanogaster genome.
Each row corresponds to an individual sequenced (in order originally sequenced from top to bottom, with the reference line at the bottom). Image generated using R/3.3.1 (package ggplot v2.1.0) with data generated by GATK VariantsToTable with individual genotypes as copy-numbers. Data and R code for this figure are located at https://doi.org/10.5281/zenodo.159282.

