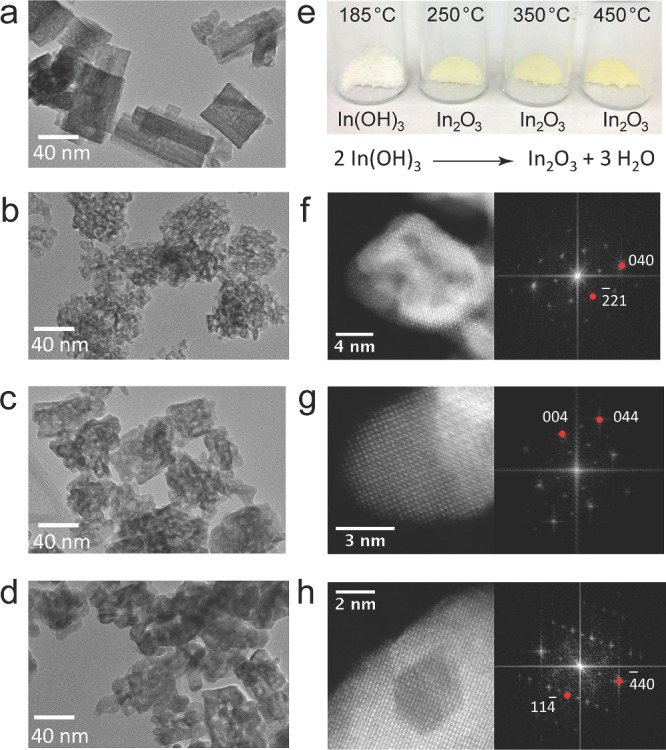
Figure 1.

Morphology, structure, and appearance of In2O3‐x(OH)y and In(OH)3 samples. a–d) TEM micrograph of samples treated at 185 °C, 250 °C, 350 °C, and 450 °C, respectively. All scale bars are 40 nm. e) Photographs of each sample after calcination as well as the overall reaction scheme. f–h) HRTEM‐SAADF micrographs (left) and FFTs (right) of the In2O3 samples treated at 250 °C, 350 °C and 450 °C, respectively. The zone axes indicated are (1,2,0), (1,0,0) and (2,2,1), respectively.
