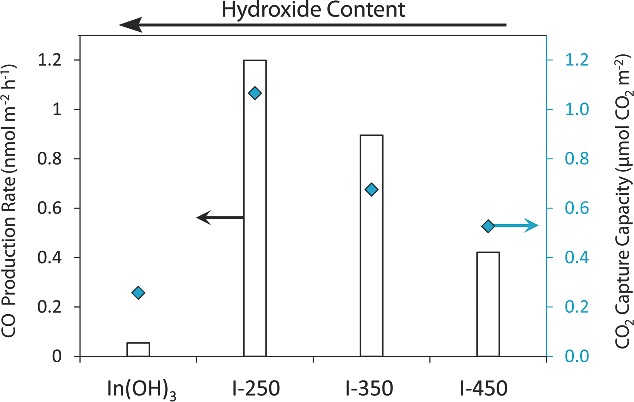
Figure 5.

Comparison between the CO2 reduction rates and the CO2 capture capacity of In2O3‐x(OH)y for samples prepared at different calcination temperatures. The white bars correspond to the CO production rates at 150 °C and the diamonds correspond to the CO2 capture capacity of each sample at 150 °C.
