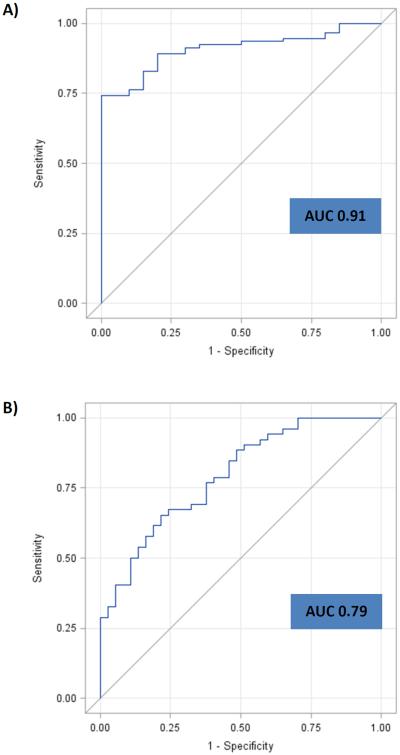
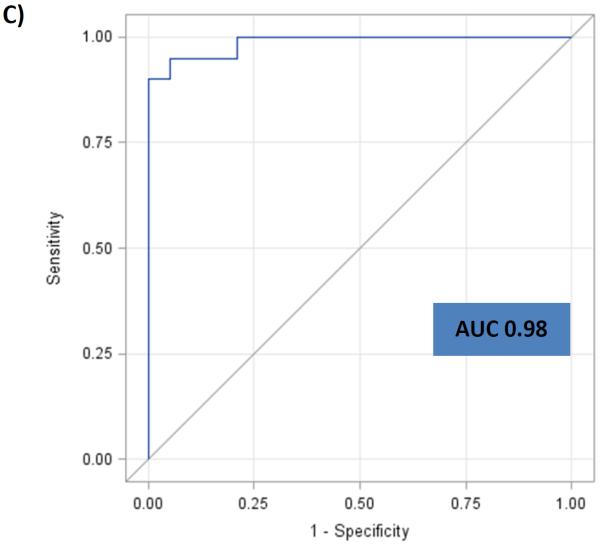
Figure 2.
ROC curves and AUC for the panel of miRNAs for “All neoplasia” vs. “control” [Fig 2A], “CR neoplasia” vs. “Other cancers” [Fig 2B], and “CRC” vs. “CAA” [Fig 2C] in the “Test” cohort. A) ROC curve for the panel of miR-21, miR-29c, miR-346 and miR-374a for “All neoplasia” vs. “Control”. B) ROC curve for the panel of miR-21, miR-29c, miR-372 and miR-374a for “CR neoplasia” vs. “Other cancers”. C) ROC curve for the panel of miR-29c, miR-122, miR-192 and miR-374a for “CRC” vs. “CAA”.


