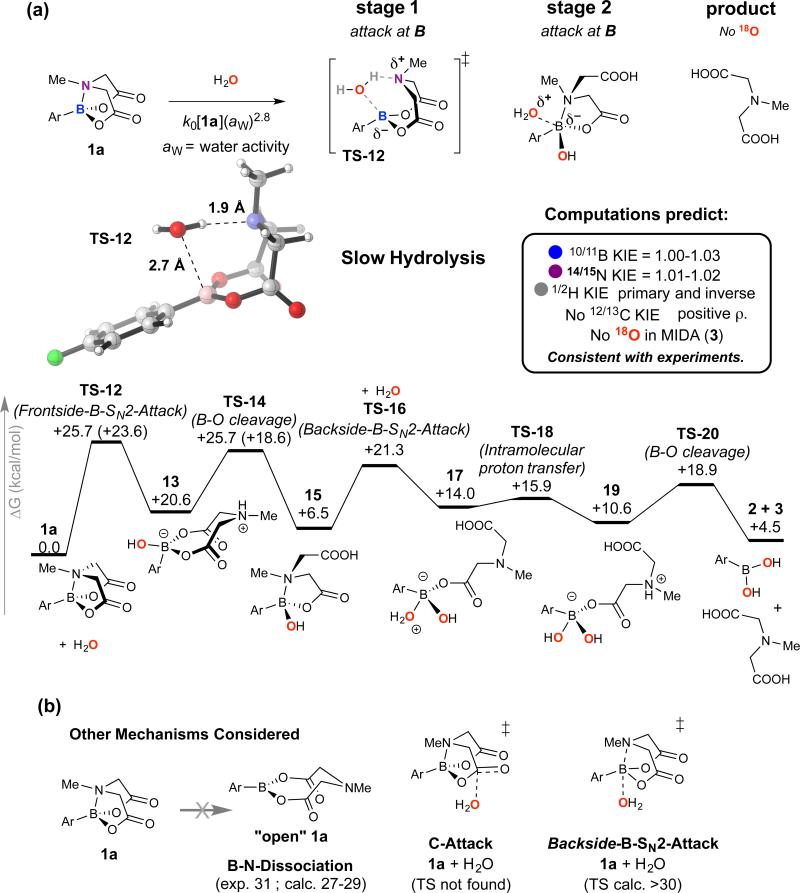
Figure 6. Slow-release Hydrolysis (k0).
(a) Summary key computational data for hydrolysis of 1a via B-N bond cleavage (TS-12). Computed minimum-energy pathway and experimental data are fully self-consistent. Nonetheless, these computed results do not resort to exhaustive, time-dependent sampling, and should thus be taken only as a model of the processes taking place in solution. (b) Other key processes considered, but eliminated on the basis of energy or kinetic isotope effects.

