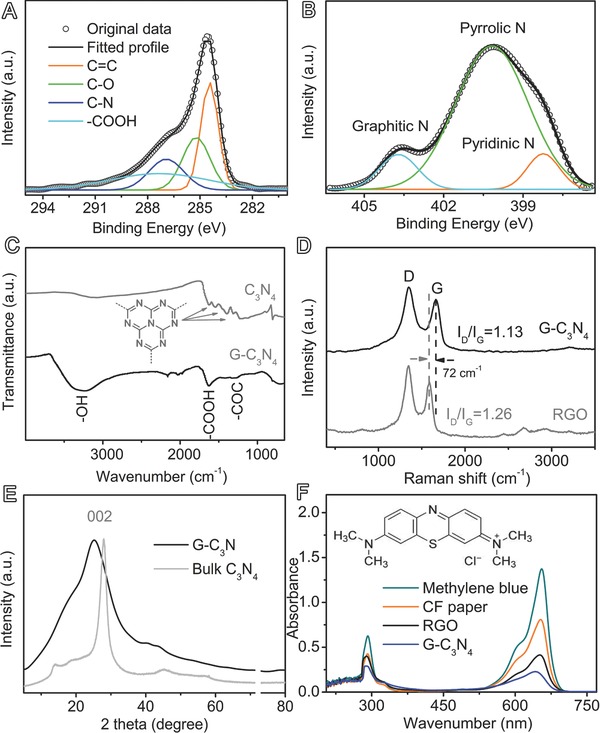
Figure 2.

The structural analyses of G‐C3N4: A,B) XPS C1s and N1s spectrum; C) Fourier transform infrared spectra (FTIR) as compared to C3N4; D) Raman spectra as compared to graphene (RGO); E) X‐ray diffractometer (XRD) as compared to C3N4; F) UV–vis spectra as compared to other samples measured by methlylene blue experiments.
