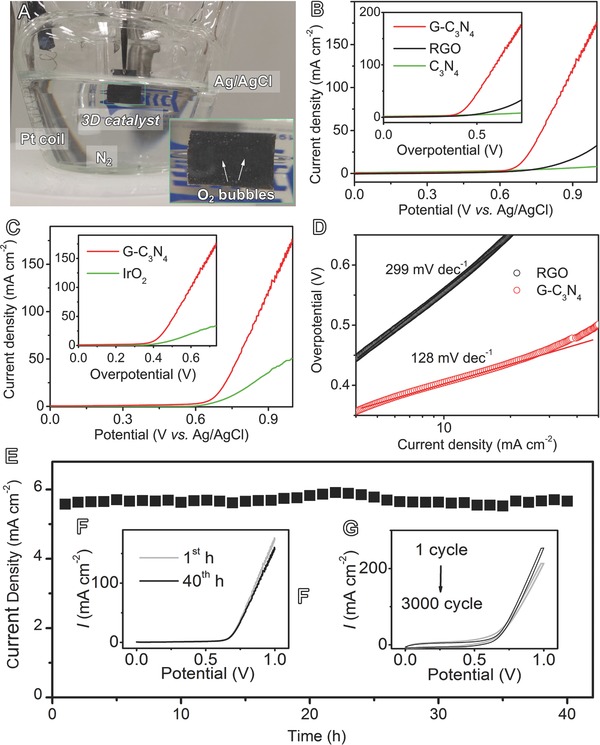
Figure 3.

OER electrochemical catalysis on G‐C3N4 in 0.1 m KOH electrolyte: A) Optical image showing the experimental setup and oxygen bubbles on catalyst electrode (inset); B,C) linear scaning voltammograms (LSV) plots as compared to RGO, C3N4, and IrO2; the insets of B) and C) show the corresponding data replotted as the current density versus overpotential; D) Tafel plots as compared to RGO; E) chronoamperometric response for 40 h; F) LSV plots at the 1st and 40th h; G) cyclic voltammetry at 1st and 3000th cycles.
