
Figure 2.
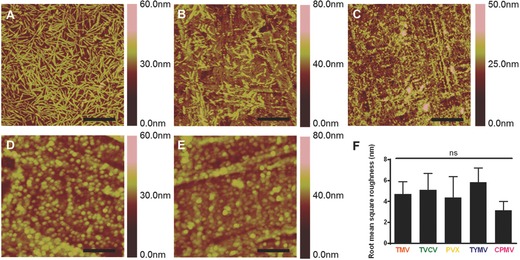
Representative AFM images showing the coverage of PDL coated substrate with different virus nanoparticles indicate the viral particles, A) TMV; B) TVCV; C) PVX; D) TYMV; and E) CPMV, are mostly intact and fully cover the coating area. F) Root mean square roughness of different virus nanoparticles coated substrates by AFM analysis. Scale bars indicate 1.25 μm in (A)–(C) and 0.5 μm in (D) and (E). The data are expressed as mean ± s.d. (n = 4) ns indicates nonsignificant and p > 0.05 based on ANOVA.