
Figure 6.
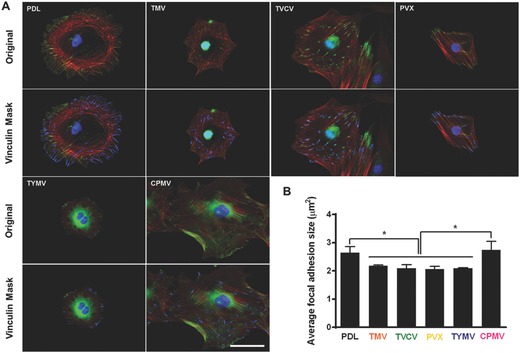
Immunochemical staining showing the difference in vinculin size of cells on PDL or virus coated substrates for 24 h. A) Immunofluorescence images of cells on different substrates at 24 h prior to osteoinduction (top panel). Color representation: nucleus (blue), vinculin (green), and phalloidin (red). The bottom panel demonstrates vinculin masking and selection of vinculins for size analysis. The selected vinculin spots are highlighted in blue. Scale bar is 50 μm. B) Average vinculin size of cells on different substrates. The data were expressed as mean ± s.d. (n = 3, * represents p ≤ 0.05 based on ANOVA).