
Figure 9.
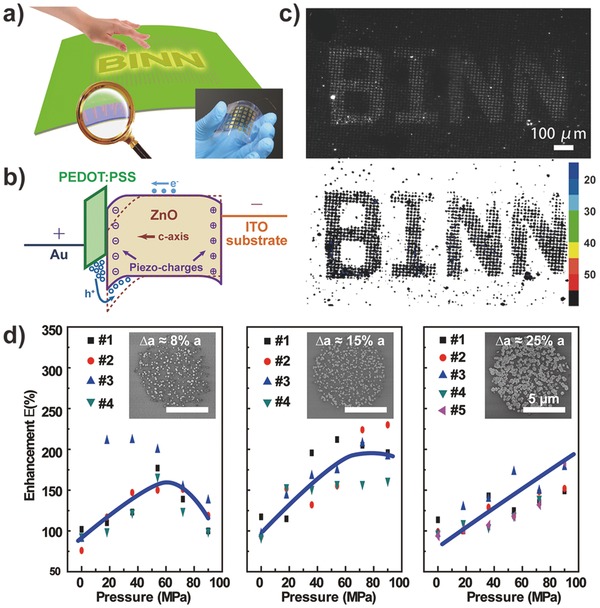
Flexible piezo‐phototronic nanowire LED array for pressure mapping. a) Schematic illustration and photograph of the flexible device. b) Electron band diagram showing the piezo‐phototropic effect. c) Pressure mapping result. d) Light intensity enhancement as a function of the area of ZnO NWs. Reproduced with permission.[[qv: 73a]]