
Figure 11.
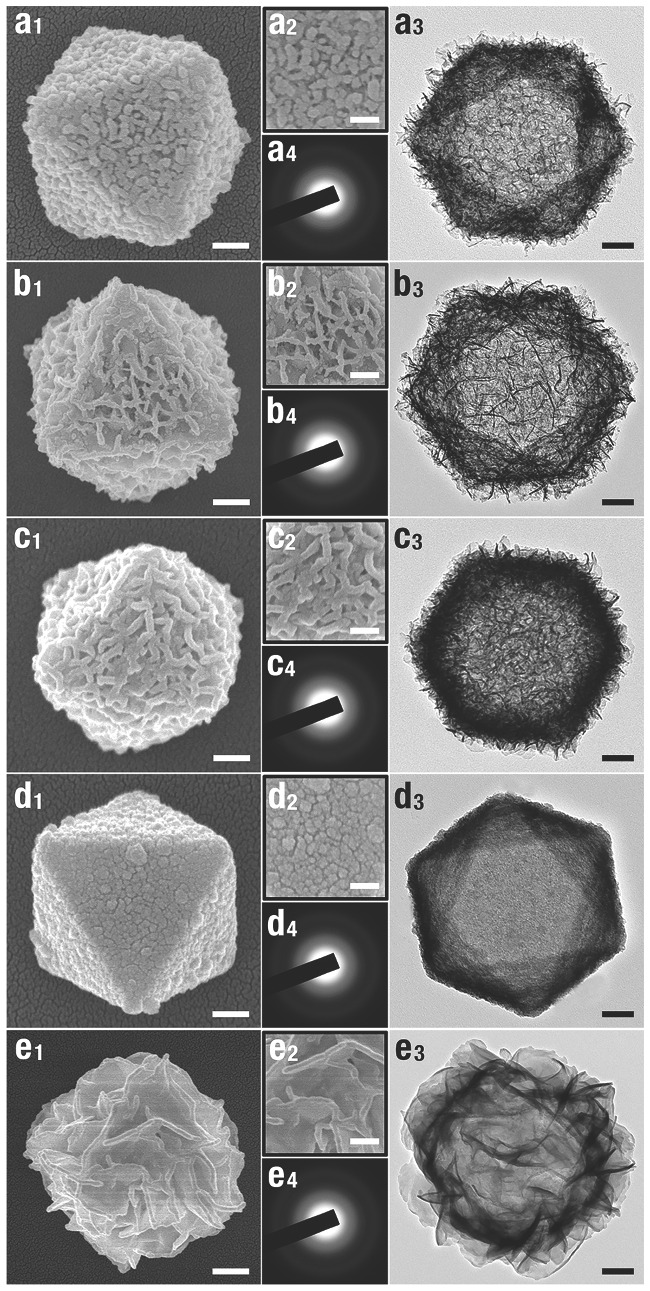
SEM, TEM, and SAED images of the a) Mn(OH)2, b) Fe(OH)2, c) Co(OH)2, d) Ni(OH)2, and e) Zn(OH)2 nanocages. Parts (x 1)(x = a–e) and (x 3) display typical SEM and TEM images of MH nanocages, respectively; part (x 2) displays high‐magnification SEM images of part (x 1); part (x 4) is the corresponding SAED patterns. The scale bars in parts (x 1), (x 2), and (x 3) are 100, 20, and 100 nm, respectively. Reproduced with permission.47 Copyright 2013, American Chemical Society.